Weekly Chart Flyby of SPX and NASDAQ Levels to Watch
With a lot of action happening very quickly on the stock market index daily charts, I thought it would be a good time to post an update on the chart structure and levels to watch – including Fibonacci Retracements – on the weekly S&P 500 and NASDAQ charts.
First, the S&P 500:

At first glance, the obvious level – to the downside – to watch is the 1,009 38.2% Fibonacci retracement which ‘just happens’ to be the 2010 price low. A price slice under 1,010 – and then 1,000 – will most likely lead to a further price sell-off to retest the 950 or even 880 level as seen by the Fibonacci grid.
With that in mind, price has formed a double top recently in 2010 and also a price high in January at the 1,150 level – that would be your upside breakout level to watch. An upside breakout above 1,150 sends the market likely higher to test the 1,220 level – but for now that is the lower probability outcome.
Traders are keen to point out the large-scale head and shoulders pattern stretching from August 2009 to present – and if the price neckline breaks at 1,000, the downside target would be a 200 point move lower to target the 800 level – or the 850 level if you drew the neckline at the 1,040 area instead of 1,100.
I’m also showing volume comparisons for July and August over the last three years – in 2008 volume steadily declined as price rose through July and then price stagnated in August and broke down in September.
In 2009 volume actually rose in July and flatlined in August as price ‘busted’ the failed head and shoulders short-term patternt to re-confirm the rally in place off the March low.
Volume steadily has been dropping after the May 6th ‘Flash Crash” – though the pattern is for volume to RISE when the market falls and DECLINE when the market rises – that’s bearish and akin to what we saw in 2008 prior to the end of the year sell-off.
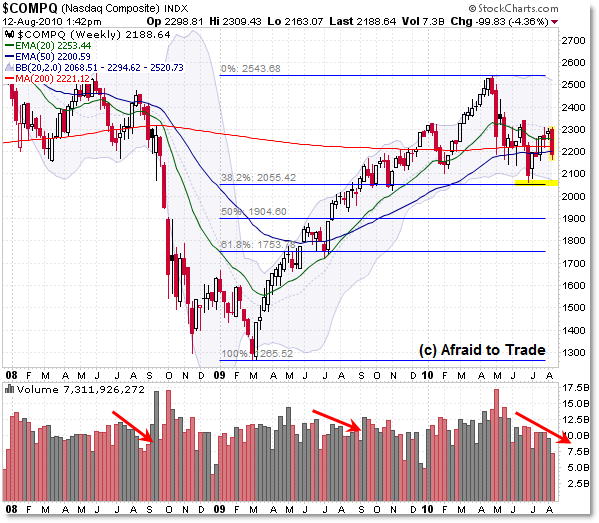
Taking all that into consideration, let’s turn now to the NASDAQ:

We see almost an identical pattern – though the only differences are in price.
Overhead resistance in the NASDAQ to call for an upside break rests at the 2,350 level, and the level for the sharp sell-off breakdown exists at 2,050.
Between there, the market has stagnated and consolidated – which is where we are currently.
The same Head and Shoulders pattern is present, and a downside break under 2,100 gives a pattern price projection target of a 450 point move down to the 1,650 level – but there is a nice confluence at the 1,750 area coming in from a price swing low in July and the 61.8% Fibonacci retracement. That would be a typical target on any big break of 2,100 and 2,000.
The pattern of volume is similar to the S&P 500, only NASDAQ volume fell during the July/August period last year while the S&P’s volume rose during the breakout.
We’re still seeing that bearish pattern of volume rising on sell-swings and falling on buy-swings.
While technically the market remains rangebound here, keep a close eye on any breakout from these price levels in the weeks or months ahead.
Corey Rosenbloom, CMT
Afraid to Trade.com
Follow Corey on Twitter: http://twitter.com/afraidtotrade

VIX has shown signal to explode up.
Rates market indicates trouble ahead.
Equity itself is wanning.
It is also the 14 consecutive weeks of money out flow from mutual fund.
http://realmarkettrend.blogspot.com/