Weekly Charting Precious Metals Gold Silver and Platinum
While Gold received most of the headlines/attention in the last few weeks, what has been quietly happening to Silver and Platinum prices?
Let’s take a look at the parabolic move in Gold and see what the companion moves have been in related precious metals Silver and Platinum.

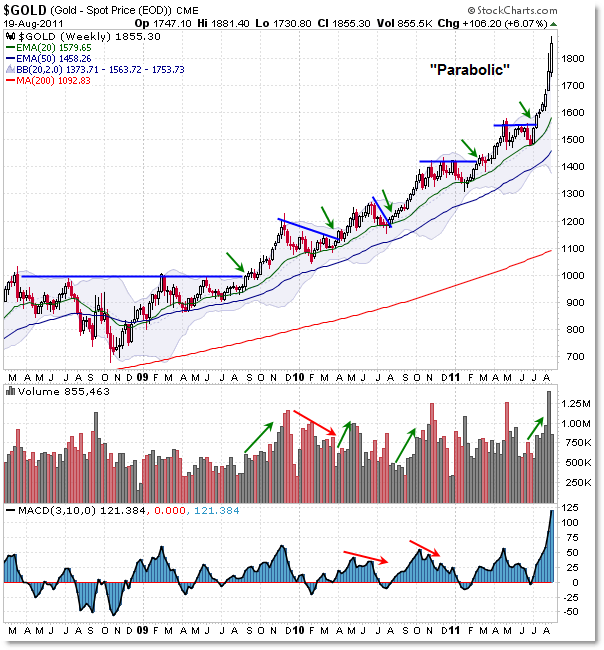
Ever since breaking firmly above the $1,600 resistance target, gold has been caught in a positive feedback loop of intense buying pressure that has taken the price ‘parabolic’ on the chart.
Prior to the August 2011 breakout above $1,600, gold was trending in a steady, comfortable, reasonable long-term uptrend after bottoming in October 2008 at the heart of the Financial Crisis.
You can see that the firm breakthrough above $1,000 per ounce set the stage for the large-scale rally that takes us to the present $1,800 level.
I’ve highlighted the longer-term buy signals in terms of “Breakouts” above resistance, though buy signals trigger perhaps easier from pullbacks/retracements into the rising 20 week EMA (green).
Given that the best pro-trend strategies are buying Breakouts from known resistance or buying on retracements/pullbacks to rising trendlines or EMAs, there are no long-term safe (low-risk) entries at the moment.
There’s no overhead resistance and the support of the rising 20 week EMA is 10% lower at the $1,600 breakout area.
But that’s a discussion for another post.
With the powerful trend-move in Gold, what’s the picture like for Silver?

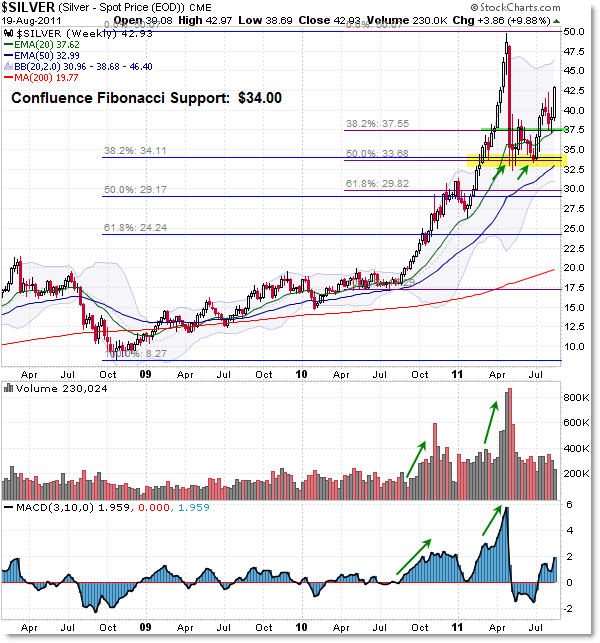
Silver similarly is rallying, but it has failed to break above the “Parabolic Arc” high of $50.00 per ounce achieved in late April 2011.
The subsequent retracement – or ‘collapse’ depending on your definition of a ‘pullback’ – took price to the confluence of the two larger Fibonacci retracement levels as drawn – this convergence appears at the $34.00 per ounce level.
Otherwise, the closer 38.2% retracement rests at $37.50 which forms a confluence with the rising 20 week EMA at $37.60.
There’s certainly open air (no resistance) on the chart between the current $42.50 area and the $50.00 high, but it could take another round of quantitative easing to fill the gap to the $50.00 level.
On any downside, watch the $37.50 to $40.00 confluence for likely support.
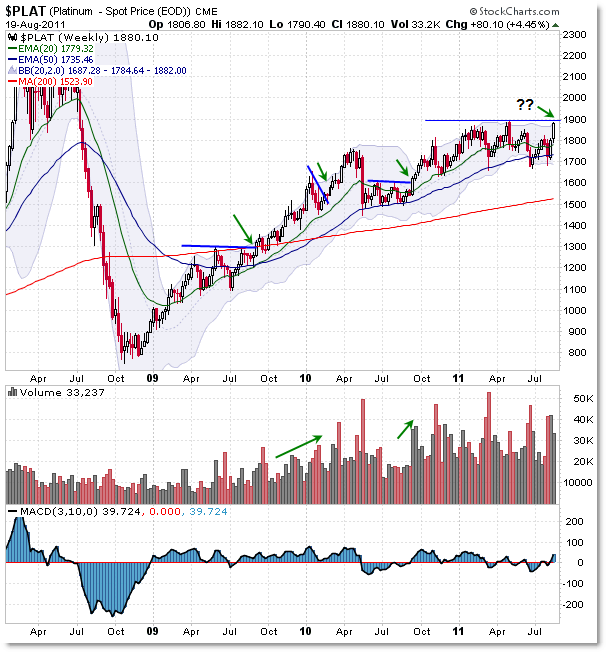
There’s something odd about Platinum’s chart – can you spot it?

I’m seeing two things that leap off the Platinum chart at me in terms of precious metal comparisons:
1. Unlike Gold or Silver, Platinum remains beneath its 2008 high
2. Gold has reached price parity with Platinum
While the numbers in the chart above obscure the price, Platinum reached its high just shy of $2,300 per ounce in March 2008 – roughly the same time than Gold and Silver peaked before the 2008 Financial Crisis/Recession.
Silver peaked at the $21 level in 2008 and recently topped at $50, while gold peaked in March 2008 just above $1,000 and now trades at lifetime highs of $1,800 per ounce.
While both Gold and Silver roughly doubled from their 2008 peak, Platinum still trails behind.
Which leads us to the next bit of very interesting information:
Gold has reached price parity with Platinum.
I’ll leave the discussions/reasons elsewhere, but I did want to highlight this development on the charts.
In addition, I wanted to show the long-term price resistance line at $1,800 per ounce in Platinum prices – a firm breakthrough to new recovery highs could be seen as a long-term buy signal should it develop.
Otherwise, I’m showing previous breakout buy signals from horizontal trendlines for reference.
Take a moment to study these charts on different timeframes for additional insights as to the price and chart behavior of these precious metals.
Corey Rosenbloom, CMT
Afraid to Trade.com
Follow Corey on Twitter: http://twitter.com/afraidtotrade
Corey’s new book The Complete Trading Course (Wiley Finance) is now available!

Comment for Silver : “it would take another round of quantitative easing to fill the gap to the $50.00 level”. Has there been massive buying in GLD, Silver at QE1 & QE2?
Based on the price movement – particularly with silver – during QE1 and QE2, it is a fair historical assumption to imagine a good rally higher if indeed QE3 becomes reality – it's just that silver has a visible upside target to play for. Mere speculation on my part.
Gold is getting pounded as we speak…has someone found out about QE 3? This site looks interesting
http://www.floridadaytrading.com