What the TICK is Saying about the Current Intraday SP500 Landscape
What short-term message is TICK telegraphing about the current intraday S&P 500?
Let’s take a look at divergent TICK Channels and reversals:

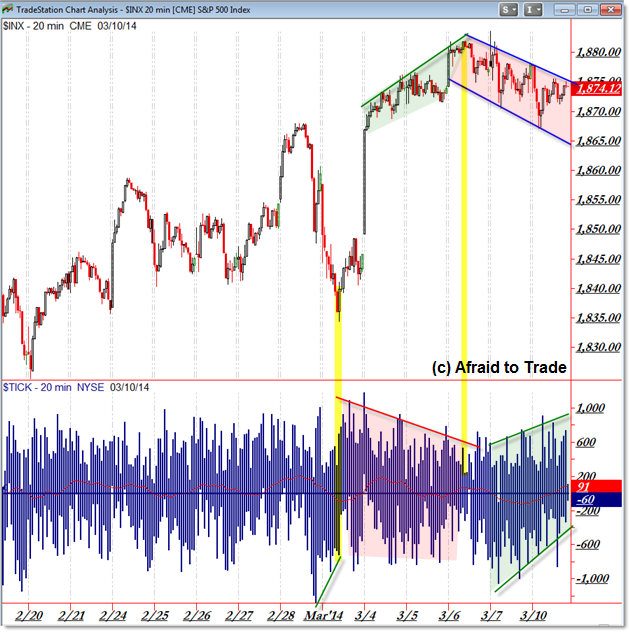
With the recent intraday action, we see price trading down in a short-term falling rectangle pattern while TICK (highs and lows) trades up in an opposite or divergent rising rectangle pattern.
Typically, these situations or non-confirmations (bearish price with bullish TICK) precede short-term reversals which appears to be the case here on the sharp rally up off the 1,868 level.
We’ll continue to monitor price with respect to the potential intraday reversal play this morning and will continue with a bullish short-term bias above the 1,875 level, a neutral one between 1,870 and 1,875, and a “bearish for breakdown” event under today’s lows near 1,868.
Here’s a larger intraday perspective of TICK and S&P 500 channel divergences:

The start of March saw a negative channel in the TICK highs when compared to the rising (all-time) highs for the S&P 500.
Price resolved to the downside recently though we see a new rising TICK Channel at the same time we see a falling SP500 channel.
See prior posts for additional reading material (and examples) of this “TICK Channel” concept:
“Trading Intraday Reversals with TICK Channels”
“January 13 Example of TICK Deterioration and Intraday Reversals”
Follow along with members of the Daily Commentary and Idealized Trades summaries for real-time updates and additional trade planning.
Corey Rosenbloom, CMT
Afraid to Trade.com
Follow Corey on Twitter: http://twitter.com/afraidtotrade
Corey’s new book The Complete Trading Course (Wiley Finance) is now available along with the newly released Profiting from the Life Cycle of a Stock Trend presentation (also from Wiley).

