What’s Up (I mean Down) with WYNN?
So, what’s going on with WYNN Resorts?
This stock has consistently appeared on our “Weak Stocks Getting Weaker” and “Intraday Strong Downtrending” Candidates for months now.
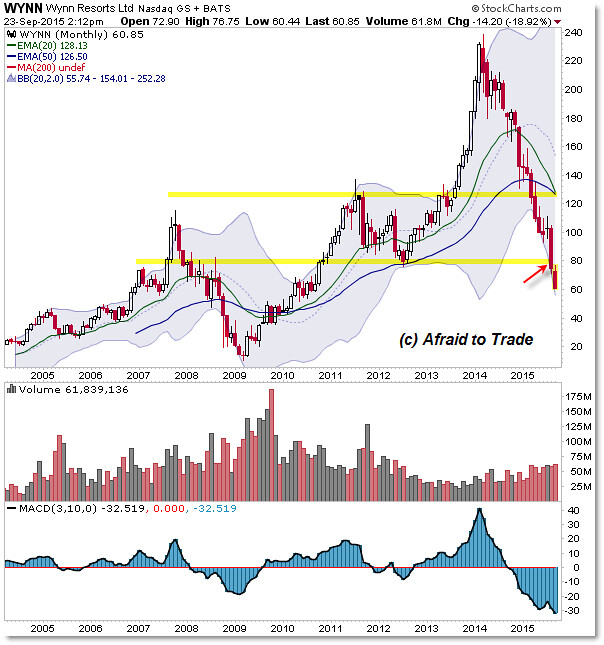
The bigger picture shows us why – and we’ll start with the Monthly Chart:

It’s not often we see a strong outperforming stock (as was the case during the 2013 breakout from $120 to $240 per share) shift gears instantly in a multi-month downtrend into relative weakness.
Nonetheless, Wynn Resorts (WYNN) is such a stock that has instantly shifted – on a V-Spike Reversal in early 2014 – from among the best best now to among worst performers.
Price tripled from the $80.00 per share low mid-2012 to the $240 level in early 2014.
From there, price has collapsed steadily – month after month – 75% lower in a hideous downtrend.
In fact, price in September just broke under the key $80.00 per share prior low pivot.
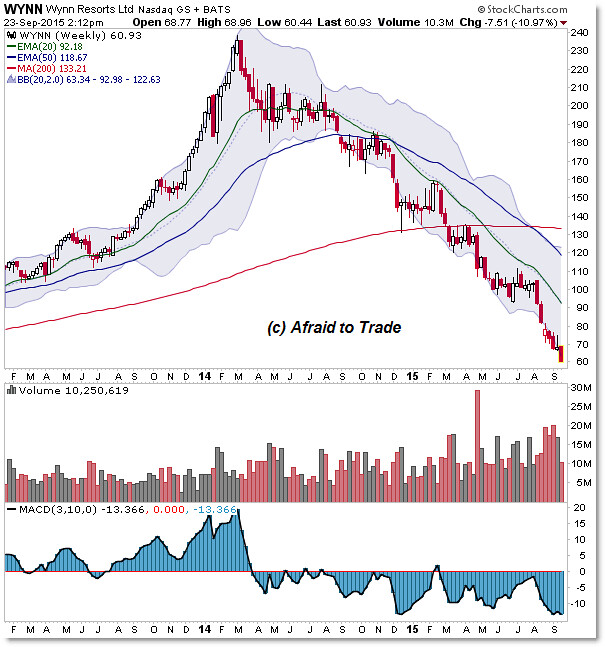
Let’s zoom-in to the Weekly chart to highlight the last phase of the rally and the new bear market:

A strong advance – outperforming virtually all other stocks – at the latter part of 2013 set the stage for a surprising V-Spike Exhaustion Reversal in March 2014.
From there, the share price has collapsed on a persistent yet stable downtrend all the way to today’s $60.
Positive divergences aren’t helping this stock as a new swing low developed into September.
Note the most bearish orientation of the weekly moving averages (green and blue) and the structural sequence of lower lows and lower highs.
We are trend followers, not trend fighters – WYNN reminds why we prefer pro-trend strategies.
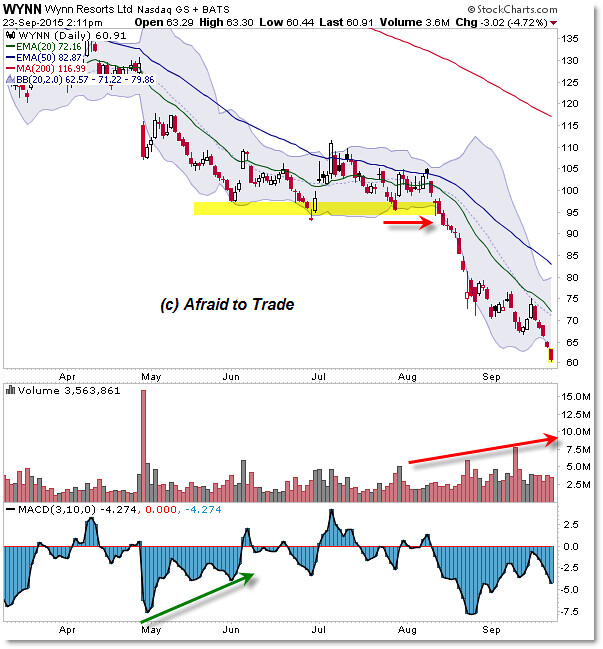
Let’s zoom closer to the Daily Chart to highlight the price action through 2015:

Buyers stabilized price after a lengthy positive divergence developed through May 2015.
This was also the key higher timeframe “Round Number” of $100.00 per share.
While this support level lasted three months, August (with the broader stock market weakness) saw a breakdown under $100 then $95 which set in motion another collapse in price lower in a breakout environment.
September for the most part saw price stabilization near the $70.00 per share level, only to see that support shelf fail over the last five days of consecutive downside price action.
Again, we prefer to short-sell “retracement” (or flag) trades that trigger into falling moving averages in a downtrend.
Focus on the current $60.00 per share pivot (bearish trend underneath – possible support bounce above) and the many lessons about trending stocks we can learn from WYNN’s example.
Follow along with members of the Afraid to Trade Premium Membership for real-time updates and additional trade planning.
Corey Rosenbloom, CMT
Afraid to Trade.com
Follow Corey on Twitter: http://twitter.com/afraidtotrade
Corey’s book The Complete Trading Course (Wiley Finance) is now available along with the newly released Profiting from the Life Cycle of a Stock Trend presentation (also from Wiley).


It’s obviously bearish trend, but I think we can easily find things changing direction, so that’s why we need to be very careful in how we approach it. At the moment I am lucky that I don’t have to do all these analysis thanks to OctaFX broker which provides me daily market updates for free and using that means I can work smoothly and since it’s so accurate I always get results in my favor which is why I love to use it.