Year to Date Elliott and Momentum Look at the Dollar and Euro Indexes
With a major trend shift potentially occurring in both the US Dollar Index and the Euro Index – both inversely correlated – let’s take a look at both of these currency indexes and observe their multi-month positive momentum divergences along with a likely Elliott Wave count.
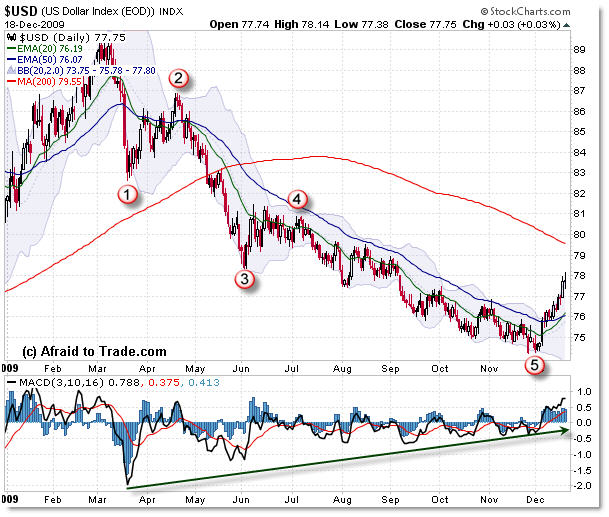
First, the US Dollar Index (daily):

Let’s take it step-by-step when viewing this chart.
First, price is in a downtrend (lower lows and lower highs along with a bearish moving average orientation) that is potentially in the early stages of a reversal.
Price has now broken bullishly above the 20 and 50 day EMAs, and these averages have just crossed ‘bullishly’ (the 20 EMA crossed above the 50 EMA), which is the precursor to any new uptrend.
Behind that, price has been declining on a lengthy, multi-month positive momentum divergence which seems to be causing the expected ‘snap-back’ rally/retracement.
Single divergences argue for a retracement only and are caution signs.
Multi-month divergences argue that odds favor a trend reversal.
See my prior posts on Crude Oil where I used a similar pattern structure to call the major reversal in Crude Oil in early 2009:
January 20, 2009: A Possible Reversal Ahead for Crude Oil and USO
February 3, 2009: Rounded Reversal in Crude Oil
March 21, 2009: A Look at Crude Oil and the Dollar
(where I highlighted the odds favoring a target of the $75 level)
The Dollar Index is showing a similar multi-month divergence pattern.
The fractal Elliott Wave count shown also hints at a reversal up, as the final 5th wave seems to have come to an end and price is now in a corrective phase upwards.
Now, let’s see the ‘inverse’ picture (on the flipside) in the Euro Index:

The picture is almost identical, except in reverse. Instead of a multi-month positive divergence, starting with the March Euro swing to the upside, we have a multi-swing negative momentum divergence.
The 3/10 momentum oscillator never reached that peak, even though prices clearly increased through 2009.
The 5-wave Elliott Fractal move is also in reverse.
For the Euro Index, we see a stellar fall, culminating with a new momentum low not seen since January 2009. That could hint at lower prices yet to come, just as the March momentum spike high hinted at higher prices yet to come.
In the meantime, watch the $142 level for a potential support ‘bounce.’
For deeper analysis and trading/positioning opportunities, become a subscriber/member to Afraid to Trade’s Premium “Weekly Intermarket” reports, or a member of the Silver Monthly plan which includes daily commentary along with weekly Intermarket Reports.
Watch these indexes very closely – a true trend reversal up in the dollar and down in the Euro will have reverberations across the other markets, including Gold, Crude Oil, the S&P 500, and bonds.
Corey Rosenbloom, CMT
Afraid to Trade.com
Follow Corey on Twitter: http://twitter.com/afraidtotrade

IN WAVE COUNT THE THIRD WAVE IS THE LONGEST ,YOUR COUNT IS WRONG
Wave 3 is not required to be the longest.
The rule is stated “Wave 3 cannot be the shortest wave.”
In both charts, critical chart features to note are the gaps that occured on or about September 6th. These features mark a moment in time where price broke a major technical level (support/resistence). As price retraces, these levels are now significant. For the USD, this key level of resistence is near $78.50; XEU it's near $142.50. Price should respect these prior levels and candles will often take the form a doji there.
Also, note the respective 200 SMA in relation to each of these key levels; convergence. With the SMA positioned just on the other side of key price levels, price will often pierce the key S/R levels, to reachout out and tag the 200 SMA. Once a touch is achieved, price often reverses to seek the support of the 20 /50 EMA to pause and catch its breath before gathering itself for another push.
With the the USD relationship is so closely tied to all other markets, consider the implications a near-term retracement in the USD might have. The equtiy markets are at a critical juncture. A shallow retracement in the USD might just provide enough support to bouy equity markets and give price another chance at breaking above key resistence levels. Hmmm.