Breakout Level Planning for SP500 and Dow Jones June 7
Here we go! Price is breaking through current resistance to levels not seen since 2015 (near all-time highs).
Let’s broaden our perspective from the current levels to the “all-time highs” and plan accordingly.
Here’s the S&P 500:

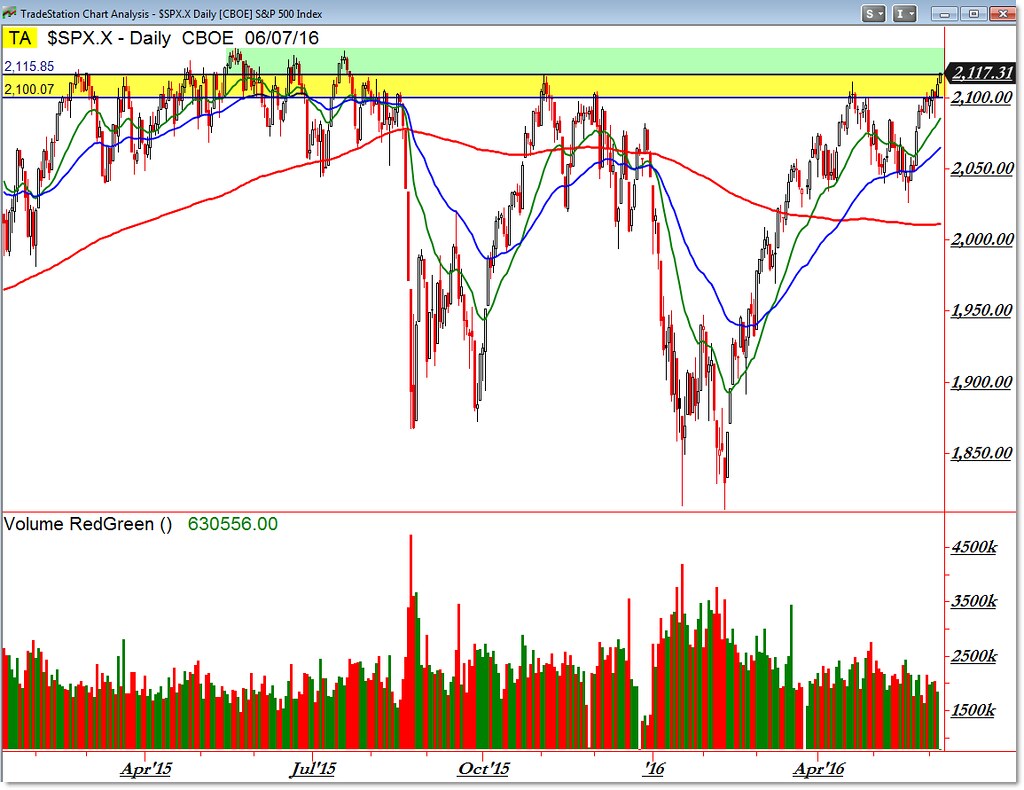
Our focal point (short-term) remains the price level between 2,100 and 2,115/2,120 where we are currently.
Note the yellow highlights and green “open air” pocket if buyers continue to push price to new swing highs.
Remember, it’s often bears (short-sellers) who help propel price higher on unexpected breakouts; they must buy-back to cover losing positions.
We’re in “thin air” territory that has been major resistance from 2015 to present.
Two sell-swings collapsed price away from this area but like a magnet, buyers drove it back two times as well.
We’ll be cautious/bearish under 2,100, neutral here into the highs, and sustained breakout bullish beyond 2,130.
Here’s the same picture in the Dow Jones Industrial Index:

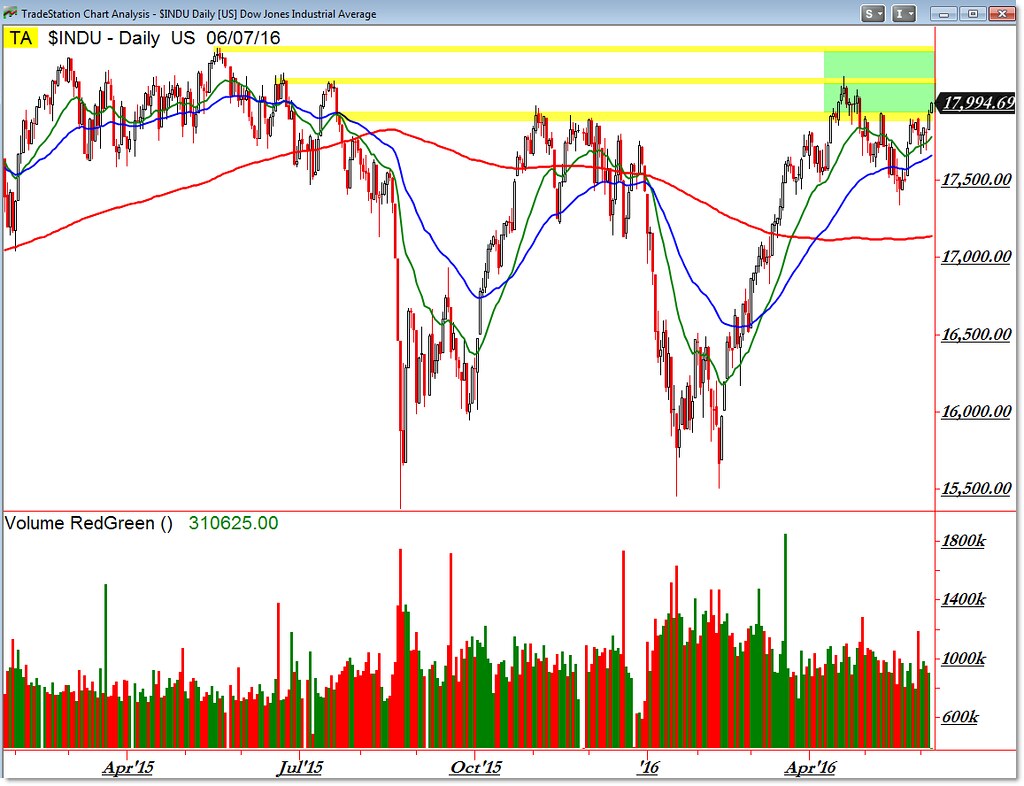
We’re focusing on the level just under 18,000 in the Dow as support (similar to 2,100 in the S&P 500) and 18,150 as the Midpoint level similar to 2,120 in the S&P 500.
The Dow Jones achieved a high of 18,351 in May of 2015 before similarly falling twice and returning to the 18,000 level.
Note the two green “open air” pockets between the current support, midpoint, and upper resistance pockets.
As you’re planning your short-term trades, be sure to put them within this context (the 2015 highs).
Follow along with members of the Afraid to Trade Premium Membership for real-time updates and additional trade planning.
Corey Rosenbloom, CMT
Follow Corey on Twitter: http://twitter.com/afraidtotrade
Corey’s book The Complete Trading Course (Wiley Finance) is now available along with the newly released Profiting from the Life Cycle of a Stock Trend presentation (also from Wiley).


One Comment
Comments are closed.