Charting the Breakout and Bullish Pathway to Start the Week
Friday’s session saw an initial breakout above key “make or break” resistance in the US Equity Indexes, and Monday morning’s action further confirmed the breakout and opened the Bullish Price Pathway higher.
Let’s take a quick look at the SP500, Dow Jones, and NASDAQ to highlight the breakout, key area to watch, and upside price pathway we’re seeing develop.
SP500 Daily Chart Trend and Breakout:

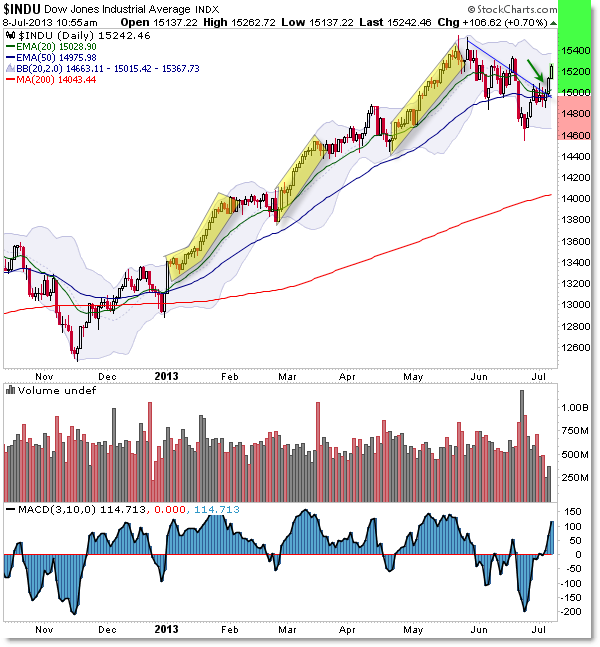
Before we discuss the current breakout, let’s look at the three highlighted periods that represent day-over-day persistent upward price action or “Bullish Pathways.”
Since the November 2012 low, there have been three periods of non-stop upward price activity – four if you count the choppy action directly off the November low – and we’re monitoring whether we’re in the middle of another day-over-day upward rally with no sign of stopping.
The recent activity would argue that we are indeed in the fourth (or fifth) period of non-stop bullish day-over-day activity on a price pathway higher.
The main idea was to watch the key EMA and price confluence resistance into the 1,620 area and once buyers pushed the market above that level, the supply/demand dynamic shifted strongly to favor the bulls.
In part, short-sellers or bears were forced to cover (buy-back losing positions due to stop-losses being triggered) as price moved higher away from the level they expected to hold as resistance – it didn’t hold.
Buyers, boosted by the better than expected Jobs Report, similarly helped propel the indexes higher with their outright buy orders.
The combination of Buyers Buying and Sellers Buying (to cover) created a Positive Feedback Loop which is the same dynamic that propelled the market straight up in the highlighted periods above.
The key will be monitoring real time activity as price moves AWAY FROM the 1,620/1,630 key level and toward the prior high into 1,655.
Quite simply, a likely breakthrough above the 1,655 target suggests that the market will continue its upward impulse toward the all-time high (1,680 level) and then perhaps above it toward – and above – 1,700.
Those parameters – targets to play for and create trades depending on what happens in real time – represent the Bullish Price Pathway higher and we have three examples of exactly how it can happen again.
The same logic holds for the Dow Jones and NASDAQ Indexes:

NASDAQ:

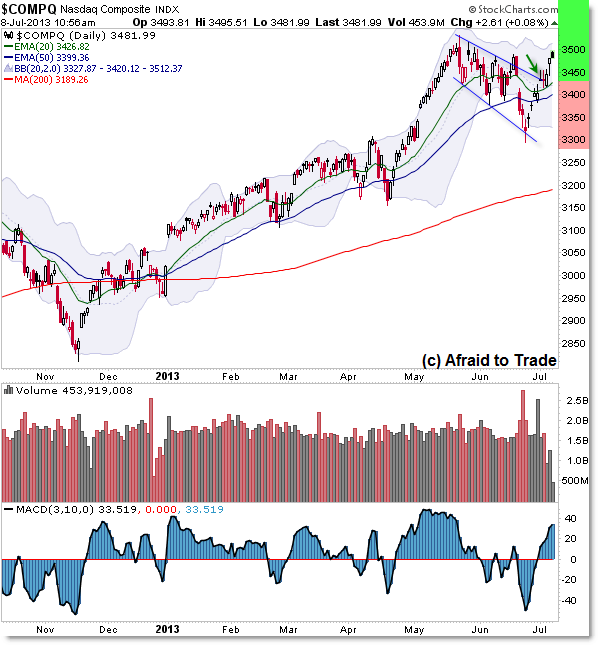
As the NASDAQ shows us clearly, it’s possible the broader US Equity Indexes triggered a “Bull Flag” price pattern which aligns with the ongoing pro-trend (bull market and higher frame bullish trends) which again targets a movement toward and above the prior May 2013 high.
The NASDAQ continues to show “Relative Strength,” meaning it is at higher relative levels than the SP500 and Dow Jones in terms of being “further away from” its 20/50 day EMA confluence level and “closer to” its May 2013 high (the NASDAQ also broke above its prior June high which remains an upside target for the Dow and SP500).
Continue monitoring real-time price action relative to the June high (target for the SP500 and Dow Jones) and then if we see a continued bullish breakthrough above the June high targets, then the price pathway remains completely clear for a retest and then likely breakthrough of the May 2013 all-time highs (new recovery highs for the NASDAQ).
Join fellow members to receive daily commentary and detailed analysis each evening by joining our membership services for daily or weekly commentary, education (free education website), and timely analysis.
Corey Rosenbloom, CMT
Afraid to Trade.com
Follow Corey on Twitter: http://twitter.com/afraidtotrade
Corey’s new book The Complete Trading Course (Wiley Finance) is now available along with the newly released Profiting from the Life Cycle of a Stock Trend presentation (also from Wiley).

