Charting the Recent Bond Funds IEF and TLT
How have the leading bond funds been holding up lately?
The prior trend had been a strong up one, but is that starting to change right now? Let’s look at the key reference support levels to clue us in to whether to expect further upside potential… or a downside reversal that could start soon.
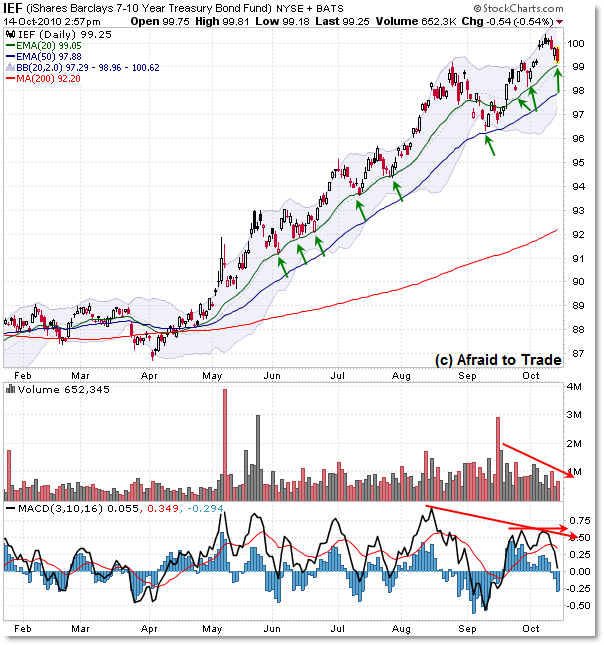
First, the shorter-term 7 to 10 year Treasury fund IEF:

The big trend strength has been in the IEF fund, starting with an initial price breakout just prior to May’s now famous “Flash Crash”
See my prior posts:
More Breakouts in Bond Funds IEF and TLT
Bond Funds IEF and TLT Nearing Key Breakout
Want Clues to a Likely Stock Market Reversal? Watch TLT and IEF
As always, trend structure is #1, and that remains true now.
The key thing to watch right now is the 20 day EMA in conjunction with the 50 day EMA (moving averages). I highlighted each time IEF bounced upwards in a retracement move off these averages.
Right now, price sits directly on the 20 EMA at the confluence support at $99. Further price deterioration – meaning a deeper price pullback – would be bearish and would lead to a short-term play to test the $98 level (50d EMA), and any further deterioration under the rising 50 EMA could signal an early trend reversal opportunity.
So in short, watch closely what happens here at $99, then what happens on a test of $98.
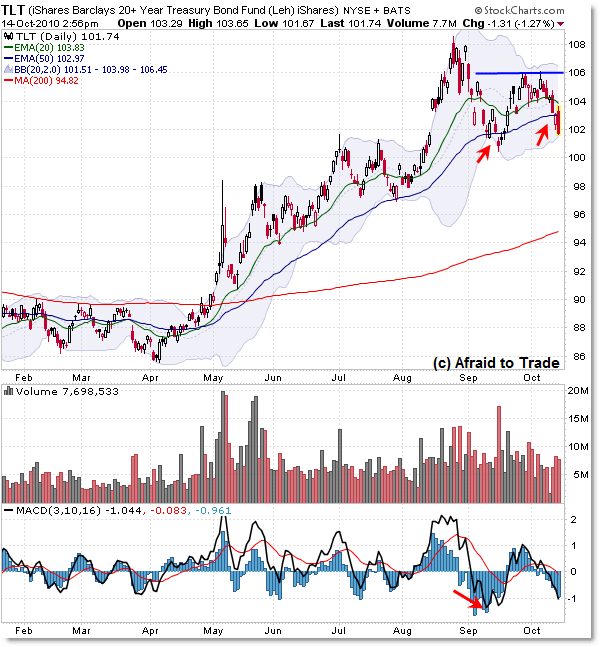
The picture is slightly more bearish in the longer term – 20+ year – Treasury fund TLT:

During the up-move, TLT also supported strongly off the rising 20 EMA , though lately the trend has flattened considerably.
The key development is that price is now under the rising 50 day EMA at the $103 price level – that’s a bearish sign.
This happened recently for one day in mid-September, only to serve as a bear trap that resulted in a rally back to the $106 level.
There is price support (from the prior swing low) at the “round number” reference level of $100.
So, to be quick, watch what develops at the $100 level.
In summary, what happens to one fund is likely to happen to the other, so if IEF breaks under its support at $98, TLT is likely to break under its $100 key support which would signal a potential early trend reversal.
And of course the opposite is true – should they both bounce off their support levels – though the negative divergences are a factor to watch – then the trend could reassert itself and higher prices would be favored.
Corey Rosenbloom, CMT
Afraid to Trade.com
Follow Corey on Twitter: http://twitter.com/afraidtotrade
