Charting the Wide Range for Emerging Markets EEM
Emerging Markets have been in the news lately with respect to a sharp sell-offs in country ETFs.
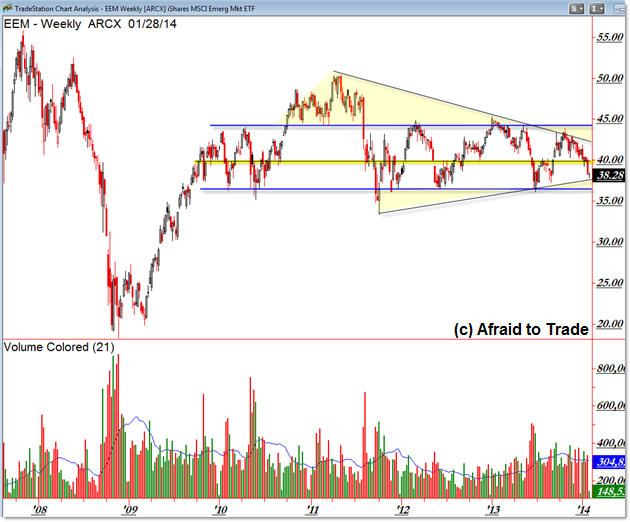
Let’s take a broader picture view of the popular ETF symbol EEM – iShares Emerging Markets fund – and chart the key pattern at work on the higher frame.

In TradeStation we can see the broader “Rectangle” Price Pattern that has clearly developed between the $35.00 and $45.00 per share level.
We can get more specific (such as $36) but we’ll use this $10.00 wide-range reference level to define the boundaries and trading strategies while price remains within this larger pattern.
While the US Equity Indexes recently traded into all-time highs (certainly well-above their 2009 levels), the EEM fund actually trades near a key level seen in late 2009 – and it’s bounced up off this level various times since then.
The “Midpoint” or Value Area of the Rectangle Pattern is $40.00 per share for the fund, and price currently trades near the $38.00 level or rising shorter-term trendline as drawn.
Failure under $38.00 suggests that price could continue toward the Rectangle Pattern low into $36.00 per share (essentially testing the 2013 low again).
One other factor to watch is volume – note how volume has increased steadily in 2013 as compared to 2013. Despite an early-2013 increase along with the red distribution volume of mid-2013, volume has actually been trailing off (decreasing) from the mid-2013 peak.
If you are trading or investing with this fund, continue to focus your attention on this broader price pattern. the $35/$36 critical price inflection level, and the current trendline interplay into $38.00 per share.
Also, be sure to check out a free affiliate offer from EWI which discusses the current state of global markets (50-pages):
Corey Rosenbloom, CMT
Afraid to Trade.com
Follow Corey on Twitter: http://twitter.com/afraidtotrade
Corey’s new book The Complete Trading Course (Wiley Finance) is now available along with the newly released Profiting from the Life Cycle of a Stock Trend presentation (also from Wiley).

