Cisco CSCO Shares Shatter Support into Open Air Pocket
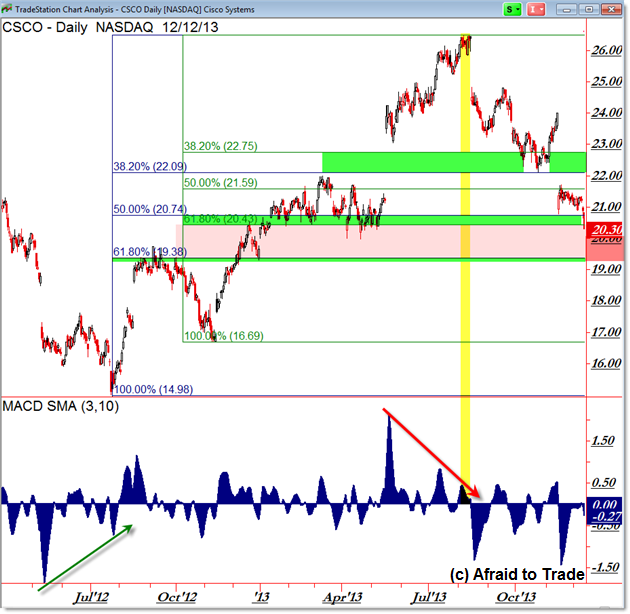
Shares of leading tech company Cisco (CSCO) shattered a Fibonacci and price support level to breakthrough to an “Open Air” chart pocket.
Let’s take a look at these developments and note the next downside target should price indeed trade through the fast zone lower (away from support).

We see the pure price Daily Chart with two Fibonacci Retracement grids overlaid on the July and November 2012 swing lows (connected to the recent August 2013 high).
We look to overlapping Fibonacci grids for possible support or inflection (buy) opportunities along with downside targets for which to play on the short-side.
First, note the support swing (retracement buy) that developed off the $22.00 per share level (green highlight) in October.
After a strong swing up, price gapped straight into the support of the next confluence support level into $20.50 per share. In a moment, we’ll see how this was a “Value Area” confluence target (support) as well.
In fact, it’s this Fibonacci and “Value Area” overlapping support target that calls our focus today.
After a weak bounce up off this target level, sellers grabbed the upper hand and have created a possible breakdown opportunity to the next lower support target near $19.00 per share.
A breakdown under the last key level of short-term support at $19.00 opens up an entirely new breakdown/reversal opportunity toward $17.00, but let’s focus now on the “make or break” current inflection.
We can see the picture clearer on the Profile-style color chart below:

Using TriggerCharts.com indicators on TradeStation, we can focus on the Yellow Lines or “Value Areas” (quantified levels that have shown the most volume and price activity over time) and smaller Blue Lines (“Open Air Pockets” or fast-zones where fewer shares and price action took place over time).
This is similar to Market Profile style logic only substituting color bars for the famous letter charts.
I drew additional yellow lines to represent the prior “Value Areas” that overlap near the current $20.50 and $21.00 per share levels which not only overlapped the Fibonacci Confluence chart above, but served as a downside target and support bounce potential recently.
Yellow Lines – Value Areas – can serve as magnets that pull price toward them. We’ll be on guard for a “pull-back” into the gravity of the $21.00 area but if price “breaks free” from the current zone, then the next “magnet” sets up into $19.00.
It’s the failure to hold support – or more specifically the current potential breakdown into the visual blue “Open Air Pocket” – that calls our attention now.
Further continuation through the pocket suggests that shares could fall further to the prior target into $19.00 per share (which, coincidentally, overlaps the Fibonacci Grid level shown above).
Even if you don’t plan to trade Cisco (CSCO) into this level, it can be a helpful educational example to follow-along.
Follow along with members of the Daily Commentary and Idealized Trades summaries for real-time updates and additional trade planning parameters as we watch a “hold and bounce” or “break and retrace” scenario play out in the near future.
Corey Rosenbloom, CMT
Afraid to Trade.com
Follow Corey on Twitter: http://twitter.com/afraidtotrade
Corey’s new book The Complete Trading Course (Wiley Finance) is now available along with the newly released Profiting from the Life Cycle of a Stock Trend presentation (also from Wiley).

