Fantastic Facebook FB Breakout and Surge May 1
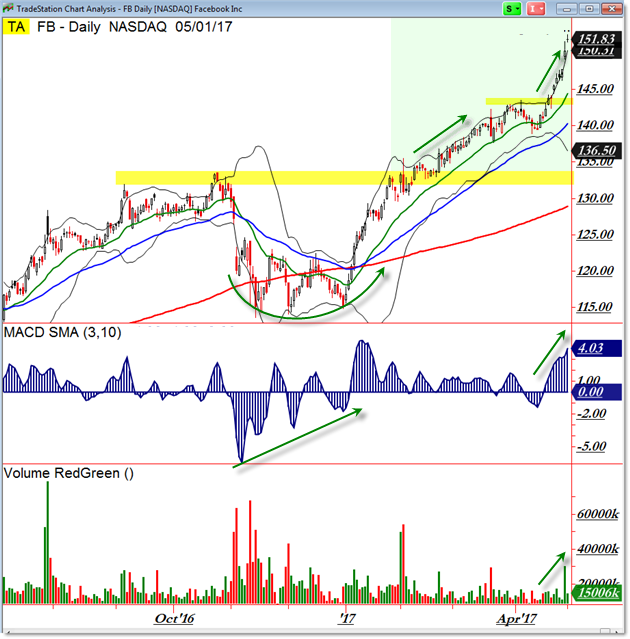
Facebook (FB) shares surged powerfully to new all-time highs after two recent bullish breakouts.
The recent upswing and breakout has been persistently strong, but is it overdone?
Let’s chart the breakout and step inside the price action:

2017 has been very kind to Facebook shares as an initial breakout above $130 sent price surging to $140.
After a small pullback, we’re seeing price surge higher – even stronger – on a second breakout in April.
For now, we’re seeing volatile price action via two recent big upside gaps that sent price surging above the 20 day EMA.
In general, we see price pull back toward the rising 20 EMA and then surge up away from it.
In other words, it’s a bit risky to get long right now in Facebook for anything other than a day trade or two.
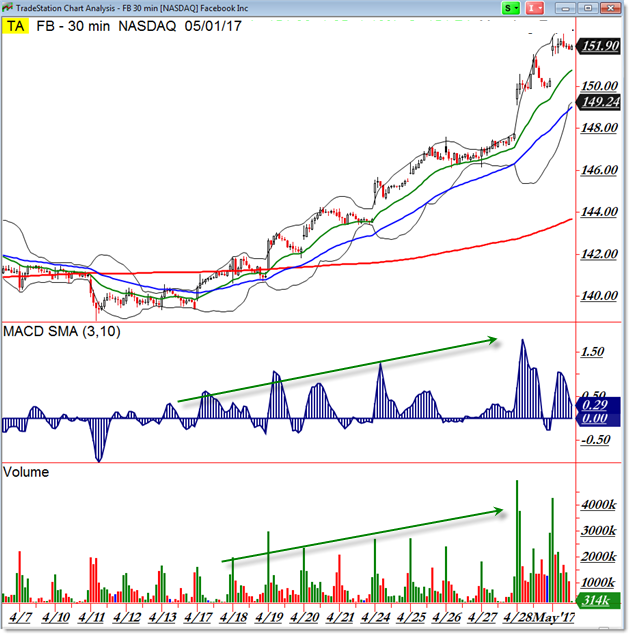
Here’s the picture and structure on the lower frame:

Note how we get smaller pullbacks or retracements to the rising 20 EMA on the lower frame chart.
That’s a great way to trade breakout or impulsive moves on the higher frame (like this).
Even with the two gaps we saw a steady pullback to the rapidly rising 20 EMA.
Volume and momentum are strong at current levels which suggests the probability for additional upside action.
When a market breaks as strongly as this, focus on your lower timeframes and trade pullbacks there.
Follow along with members of the Afraid to Trade Premium Membership for real-time updates and additional trade planning.
Corey Rosenbloom, CMT
Follow Corey on Twitter: http://twitter.com/afraidtotrade
Corey’s book The Complete Trading Course (Wiley Finance) is now available along with the newly released Profiting from the Life Cycle of a Stock Trend presentation (also from Wiley).”

