Green Mountain GMCR Triggers Bull Flag Breakout
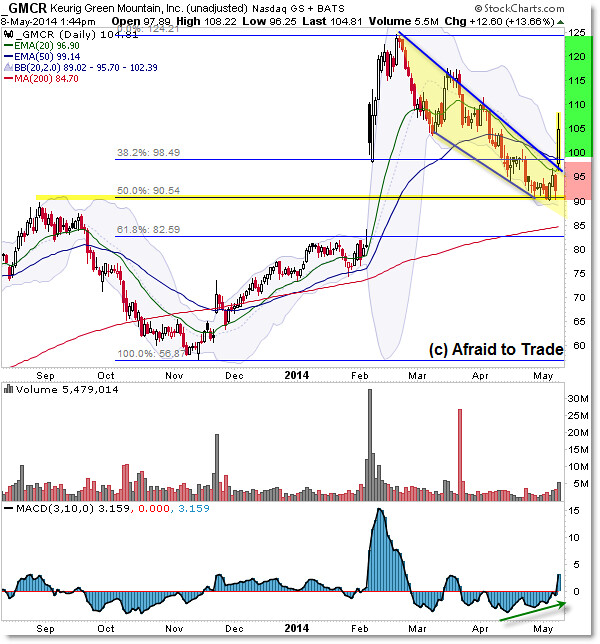
Keurig Green Mountain (GMCR) triggered a Bull Flag support bounce and breakout play on the Daily Chart I wanted to highlight – it can serve as a candidate and great educational lesson.
Let’s study the chart, note the levels, and learn a quick lesson from this popular pattern.

Generally, a breakout is a sign of impulse or strength that suggests additional continuation in the direction of the breakout.
We saw this happen on February 6th with a powerful breakout – on high volume – above the $90 prior high (September) and $100 (round number) resistance levels.
Essentially, a breakout event is fueled in part by the bulls/buyers who join also with the bears/sellers who are forced to buy-back shares at a loss.
The “feedback loop” tends to propel price higher during a breakout event like we saw in February.
Price peaked into $125 and retraced lower toward the confluence of the September 2013 high and the (new) 50.0% Fibonacci Reracement near the $90.50 level. Pay close attention to this level on the hourly chart below.
Today, price broke both the falling ‘flag’ trendline as highlighted along with the 38.2% Fibonacci Level ($98.50) and – more importantly – the $100 “round number” resistance again to trigger a powerful impulsive “buy” day for today’s session.
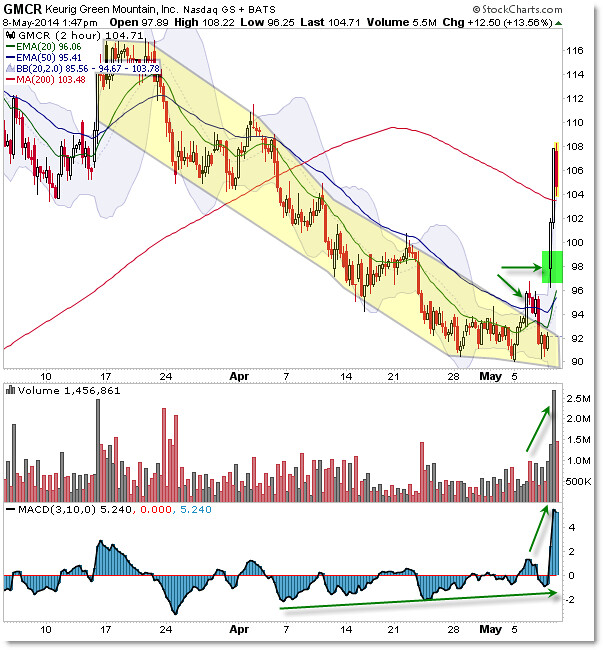
Here’s the structure and development- and breakout- on the intraday chart:

Again, let’s start with the $90.00 per share higher timeframe support (confluence) reference area.
VERY aggressive traders could pick up shares (buy) each time price traded near the $90 per share level and place a stop at gradients beneath $90 ($89, $88, etc).
A failure to hold or bounce up off support ($90) could have triggered an alternate thesis breakdown or short-sale trade (always plan for the unexpected).
Nevertheless, on May 6th, price broke above the falling trendline near the $93 per share level for an initial breakout play… that resulted in a retracement all the way back to $90 (frustrating early breakout traders with tight stops).
On today’s session, we saw an immediate gap higher and positive feedback loop (bulls buying to get long; sellers buying to cover losing positions) propel price through $98 and now $100.
GMCR topped our intraday update of potential trend day/breakout candidates this morning.
Continue monitoring the breakout and the interplay between the Daily Chart upward pathway and lower frame action and monitor price should it continue trading up in “breakout bull flag” territory above $100.
Follow along with members of the Daily Commentary and Idealized Trades summaries for real-time updates and additional trade planning.
Corey Rosenbloom, CMT
Afraid to Trade.com
Follow Corey on Twitter: http://twitter.com/afraidtotrade
Corey’s book The Complete Trading Course (Wiley Finance) is now available along with the newly released Profiting from the Life Cycle of a Stock Trend presentation (also from Wiley).


One Comment
Comments are closed.