New Fibonacci Reference Grid and Color Arc Structure Chart for SP500 Dow and NASDAQ
With the breakdown under the key “Arc Trendline” Structure pattern in the Dow and S&P 500 (with something surprising happening in the NASDAQ today), let’s take a look at the new intraday chart and update our intraday (short-term) Fibonacci Retracement Reference Levels.
We’ll start with the S&P 500:

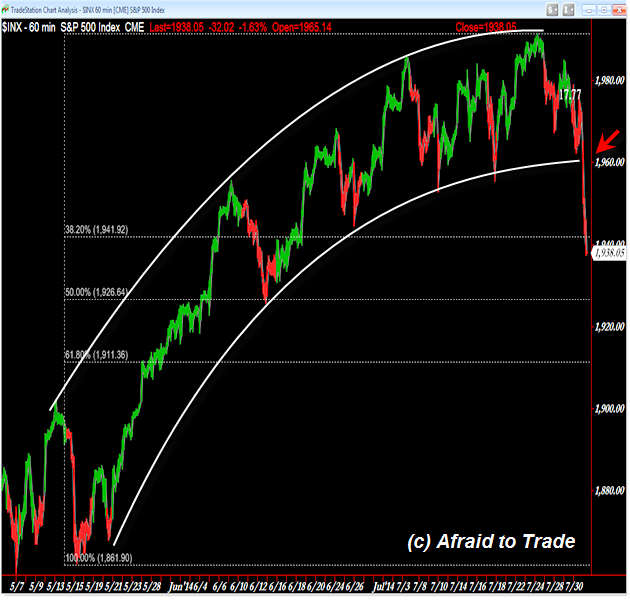
Using a custom indicator in TradeStation, we see the hourly “Color Structure” chart forming a gently sloping Arc Trendline Structure pattern.
Structure simply refers to the progression (pattern) of price highs and price lows over time – in this case, it takes the form of an arc.
Price broke powerfully under the arc this morning and now trades slightly under the 38.2% Fibonacci Retracement near 1,942.
A further sell-off opens a pathway to a more important confluence target near 1,925 (the ‘halfway’ point).
The picture is similar in the Dow Jones Industrial Average (hourly):
The Dow Jones showed a wider arc trendline pattern and today’s breakdown under the 16,850 lower support (and confluence with the 38.2% Fibonacci Retracement) collapsed the index all the way to the currnet low at the 61.8% Fibonacci Retracement at 16,650.
Of the “Big Three” indexes here, the Dow has retraced (fallen) all the way to the 61.8% ‘last’ Fibonacci Level.
Let’s compare that to the NASDAQ which is actually holding up well (structurally speaking):

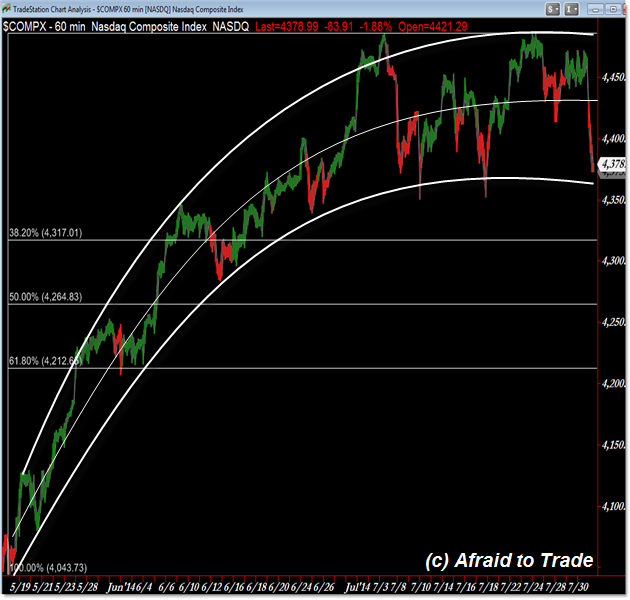
Unlike the S&P 500 and Dow Jones, the NASDAQ index has neither broken under the rising “arc structure” trendline nor the 38.2% Fibonacci Retracement (4,317).
Under this metric, the NASDAQ is showing relative strength to the other indexes and we monitor the price action into the lower arc near 4,370.
Bookmark this page and reference these charts for near-term trading set-ups with respect to the trendline arcs and – perhaps more importantly – the Fibonacci Retracement Reference Levels.
Corey Rosenbloom, CMT
Afraid to Trade.com
Follow Corey on Twitter: http://twitter.com/afraidtotrade
Corey’s book The Complete Trading Course (Wiley Finance) is now available along with the newly released Profiting from the Life Cycle of a Stock Trend presentation (also from Wiley).

