NVIDIA NVDA Crashes Through Bearish Wedge to Daily Target
Bullishly trending NVIDIA (NVDA) just broke a bearish rising wedge on negative divergences, collapsing instantly to a daily chart support target.
What’s up next for the stock and is there a trade in it? Let’s check:
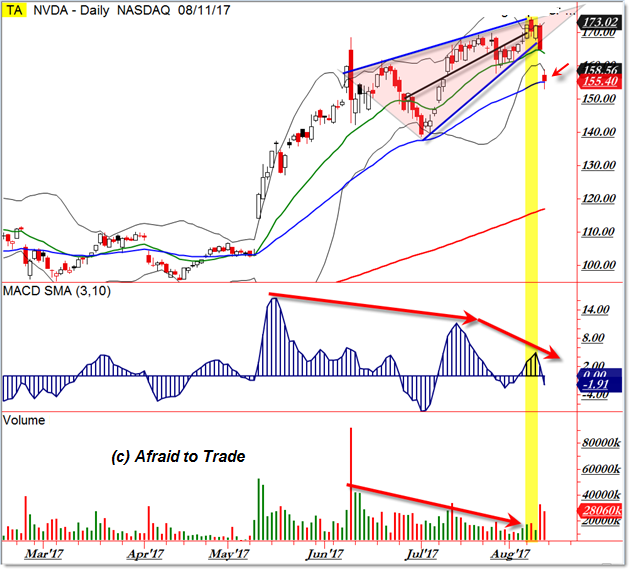
NVIDIA repeatedly showed up on our “Strong Stocks Getting Stronger” scan, but the recent negative momentum and volume divergences into $170 gave us pause.
Our caution increased when a Bearish Rising Wedge pattern developed as highlighted.
Yesterday and now today with a big bearish down gap on high volume, NVIDIA shares collapsed to the rising 50 day EMA at the $155 per share level, a downside sell-swing target.
Keep the Daily Chart in mind as you step down to the Intraday Chart to highlight the Wedge:
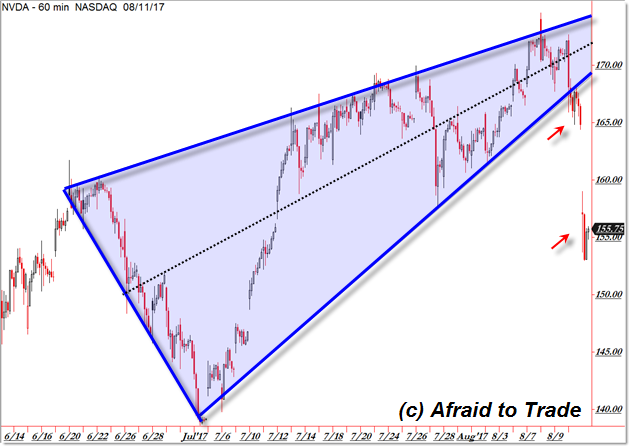
This is a textbook pattern of higher timeframe divergences with a lower timeframe bearish (potential) reversal pattern.
Yesterday saw an initial breakdown beneath the $167 lower (rising) trendline, triggering initial stop-losses (from bulls) and drawing aggressive sell-short trigger-entries from bears.
The bears were rewarded and eager bulls were punished with a gap-down to the target.
From here, focus on the immediate departure “away from” the $155 level which is taking the form of an intraday reversal at the moment.
Frame your trade on the Daily Chart, playing a breakdown under support (hasn’t happened yet) or the continued short-term bullish bounce (happening this afternoon).

Follow along with members of the Afraid to Trade Premium Membership for real-time updates and additional trade planning.
Corey Rosenbloom, CMT
Follow Corey on Twitter: http://twitter.com/afraidtotrade
Corey’s book The Complete Trading Course (Wiley Finance) is now available along with the newly released Profiting from the Life Cycle of a Stock Trend presentation (also from Wiley).”