October 16 Trendline and Level Planning for US Equity Indexes
With equity markets continuing to focus on headline news from the US Capitol (is there a deal or not?), let’s take a broader look at the Dow Jones, S&P 500, NASDAQ, and Russell 2000 equity indexes and note relative strength and weakness within the context of rising parallel trendlines.
We’ll start with the S&P 500 and Dow Jones which show similar structures:

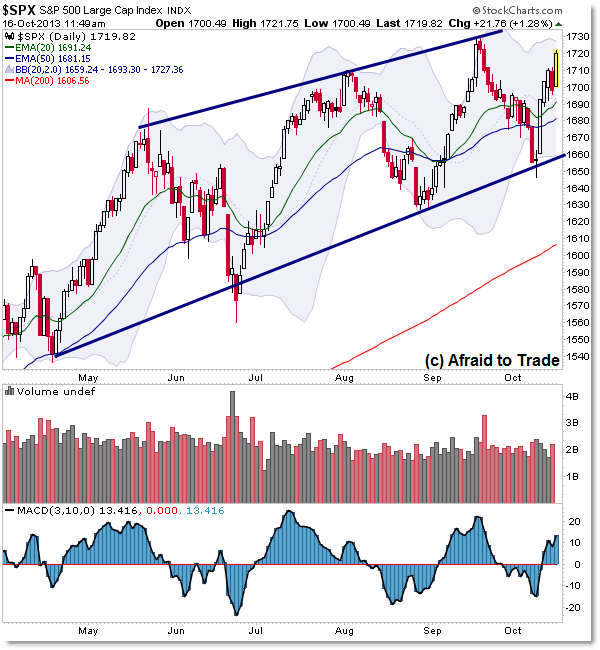
As I highlighted in yesterday’s post, the SP500 continues to trade within rising parallel trendline channels and paused into the Midpoint of the pattern.
This post is a quick quad-index check-up, and we note the potential upside breakout through the midpoint which would extend the upside target toward the 1,745/1,755 level depending on how quickly price rallies up above the 1,700 level.
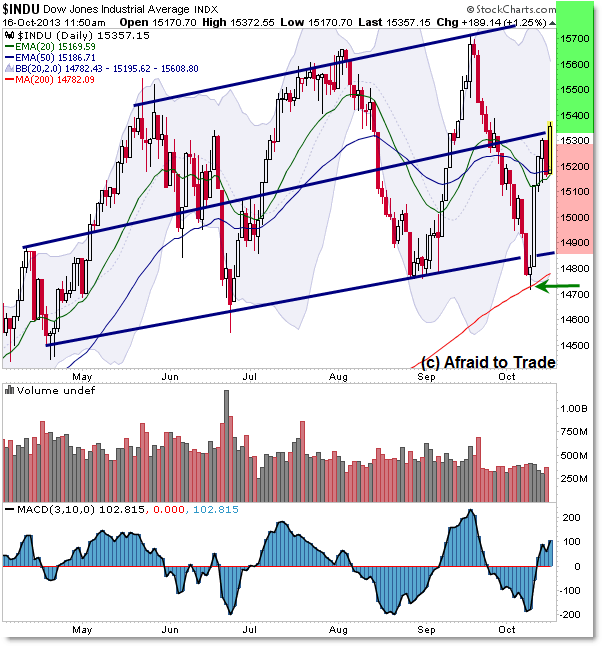
While the SP500 is above the midpoint and closer toward the high, the Dow Jones continues to show relative weakness in that it is the index that is the greatest distance from its recent September high.

After a trendline Bear Trap event in early October which was actually a successful test or support-bounce up off the rising 200 day SMA, the Dow Jones traded powerfully higher off the 14,700 level toward its pattern midpoint into 15,350 (achieved today).
Like the SP500, we’ll use similar logic and planning for the Dow Jones Index in terms of an upward movement increasing the upside target to the 15,900 or 16,000 upside trendline pattern target.
Both the NASDAQ (tech-heavy) and Russell 2000 (small-cap) equity indexes have shown relative strength to the Dow Jones and S&P 500.
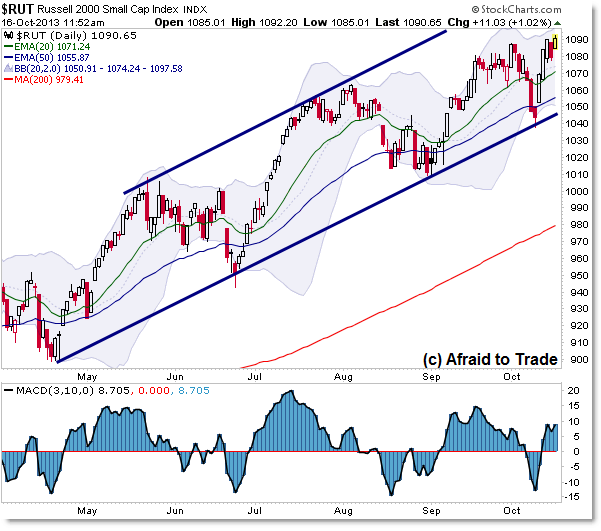
If you only focus your attention or trades on the SP500, you may not have noticed today’s breakout to new all-time highs in the Russell 2000 and to new recovery highs for the NASDAQ:

The NASDAQ shows relative strength due to its breakout above its September high and its location above the Midpoint of the Rising Parallel Trendline pattern.
The NASDAQ upper potential target stretches toward 3,900 in the event we see a continuation of the pro-trend rally and a breakout (short-squeeze) environment.
The Russell 2000 shows similar strength with the NASDAQ:

Finally, the Russell 2000 also broke (albeit gently) to new highs above the September 2013 peak – compare this to the S&P 500 and Dow Jones above.
Generally, it is a sign of broad strength or optimism for the future when the NASDAQ and Russell 2000 outperform the S&P 500 and Dow Jones. We’ll continue watching for additional upside price action to see if that tendency holds true for the near future.
Continue watching breaking news updates as necessary, particularly related to the US Congress, and monitor price action in all indexes relative to the Rising Parallel Trendline (channel) patterns and Midpoints.
I’ll be discussing breakout, retracement, and reversal trading tactics live at the Las Vegas Traders Expo on November 22 – join me and your fellow traders at the free expo!
Corey Rosenbloom, CMT
Afraid to Trade.com
Follow Corey on Twitter: http://twitter.com/afraidtotrade
Corey’s new book The Complete Trading Course (Wiley Finance) is now available along with the newly released Profiting from the Life Cycle of a Stock Trend presentation (also from Wiley).
