Strangely Enough, Market Internals DO Matter – an Update
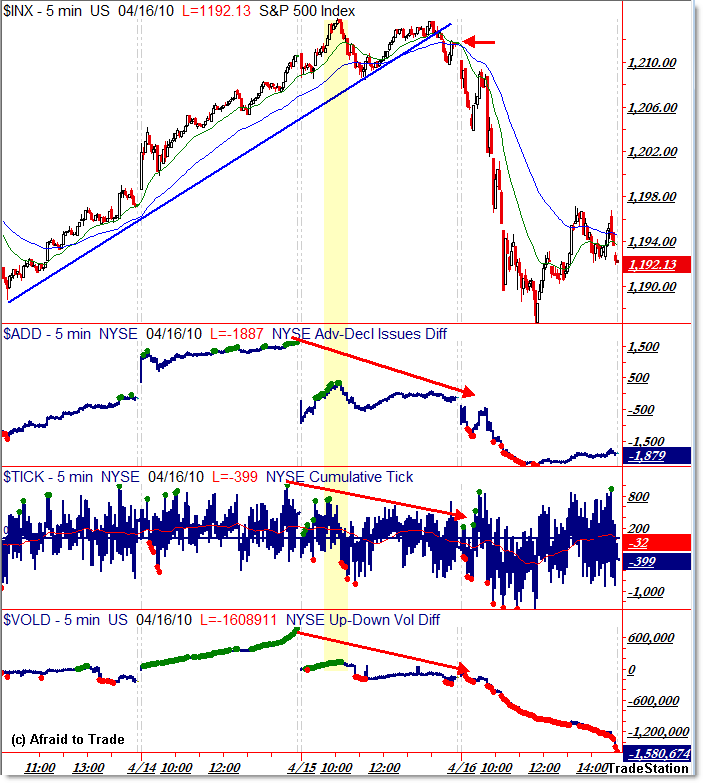
Just when it seemed like this market would continue its journey to the moon, we had a major one-day (at least) snap-back in price that erased the gains of the last week, plunging us in one day to an intraday low price not seen since last Thursday, April 8th.
Today’s post is an update of my afternoon post “SP500 Market Internals Send Strong Warning Signal,” and I hope you took advantage from the lesson I wrote in yesterday’s post.
Today’s sharp downside action reminds us that – eventually – internals DO matter.
After peaking yesterday morning at 1,212, the S&P 500 (and other indexes) flashed dramatic non-confirmation or massive negative divergences in market internals, including Breadth, TICK Extremes, and Breadth Volume Difference.
I wrote yesterday:
“Thus, internals are sending a strong “warning signal” that would be a sell-signal (or protect capital signal) if we see a break under the trendline or the intraday swing low at 1,208.”
I had also emphasized the importance of Trendlines, and to watch for confirmation (and an official sell-signal) with a break to the downside (under 1,208) of the rising trendline.
Today’s chart reveals why it’s very important to watch for key non-confirmations in market internals, but that divergences are not enough to generate sell signals. We need breaks in trendlines to increase our confidence in a trading signal.
All the typical cliches apply: “What goes up, must come down,” “The higher the rise, the lower the fall,” etc.
If you don’t already, pay particular attention through the trading day from the signals that market internals send – they really do matter.
To learn more and follow my in-depth analysis and commentary each day, become a member to our Idealized Trades Daily Report service.
Corey Rosenbloom, CMT
Afraid to Trade.com
Follow Corey on Twitter: http://twitter.com/afraidtotrade


Corey,
Great call yesterday, as usual, you never cease to impress. Out of curiosity, where do you see SPX going from here in the next couple of weeks?
Cheers,
A
Hey Alex! Thanks!
That's what I'll be studying this weekend with my reports and analysis. Way too early to say anything just after market close today!
For sure, after a day like today, remaining objective is not easy. Better let everything sink in before coming to any conclusions.
I'll be waiting eagerly for your report.
Have a great weekend,
A
Corey,
Great TA. I found your website a few months ago, and I would like to thank you. I have a learnt a lot from you. I am trying to read every post in you archive, and your TA is really impressive. Your weekly report to which I subscribe is great.
Could you tell me if you use P&F charts, and if yes what is its importance in your toolkit. Thanks.
C
I thought markets weren't manipulated? Oh wait, it's now proven. Furthermore, a report came out a few weeks ago that proved JP Morgan manipulated the precious metals market around futures expiration. This blog claimed that blaming manipulation for poor trades was counterproductive. Fair enough, but to believe no manipulation exists is equally foolish.
Understanding how the markets are manipulated is the first key to success in trading. I have to laugh a bit at people poring over charts and “technical analysis” when no one making billions in the market uses such arcane techniques.
Good blog!!
Thank you.
I have still been thinking about overall volume and have been for awhile before your post. The notional value of trades is around even to 50% higher now that it was at the bottom. You can see this on bats.
http://batstrading.com/market_summary/ – check notional value and change dates.
I've discussed this some friends and I personally think that for the overall market, there is not information available to tell you anything. Do the bear etf's get counted in volume? If a computer buys 500 stocks and shorts the spy is that is counted as volume, even though the actual trade is one investor buying the spy to replicate the 500 stocks. How can those arbitrages be subtracted out? Same goes for all etf's. There are many other issues with my round about point being volume on an individual stock might be telling but overall volume can be misleading. Volume on individual stocks looked at over a longer time frame is not weak. Apple for instance. Volume is down but still higher than from 2001-2004.
BAC before 2006 never did a day's volume above 15 million shares. Now it does over 100 million on a slow day.
My only point is I'm not sure if the volume story is telling the right story or any story.