Planning the SP500 Daily and Weekly Chart for August 26
To get our week started, let’s take a quick overview of the Weekly Chart (showing no resistance) and the Daily Chart (showing a key level on which to focus) as we plan for potential outcomes for the week ahead.
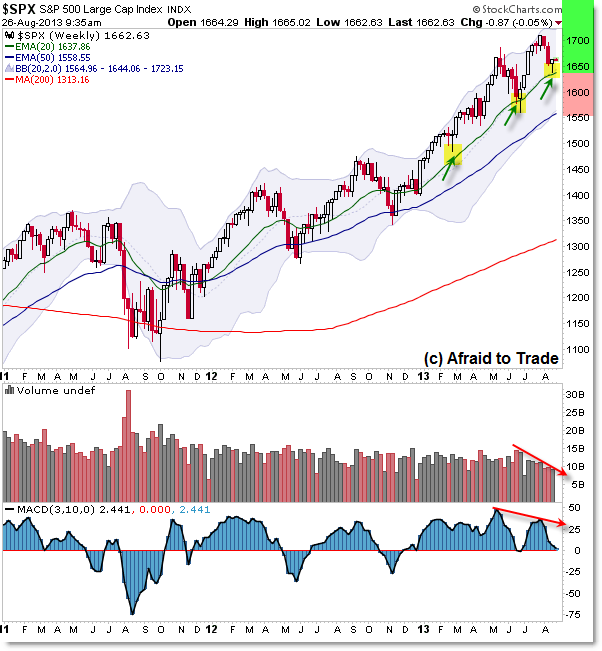
We’ll start with the picture on the Weekly Chart which shows bullish strength:

First and foremost, our “triple timeframe” alignment continues with uptrends on the Monthly, Weekly, and even the Daily Chart. That’s the backdrop from which to build your analysis.
We also see three recent “pullbacks” or retracements to the rising 20 week EMA (currently just under 1,640) and the successful pro-trend rallies up off the rising weekly average.
If we take the chart in simplest terms, the recent pullbacks sets the stage for a continued pro-trend rally toward – then perhaps exceeding – the recent 1,707 high.
In other words, there is no further chart-based resistance after the successful test of rising support.
Going beyond simple price structure which does suggest new highs in a continued uptrend, we do have a clear caution or “watch out” signal given from Volume (diverging) and Momentum (also diverging).
This makes us slightly less confident in the market’s ability (or buyers’ ability) to achieve a new all-time high, but that doesn’t mean the market is forced to reverse lower just because a visual divergence is present. It just signals caution.
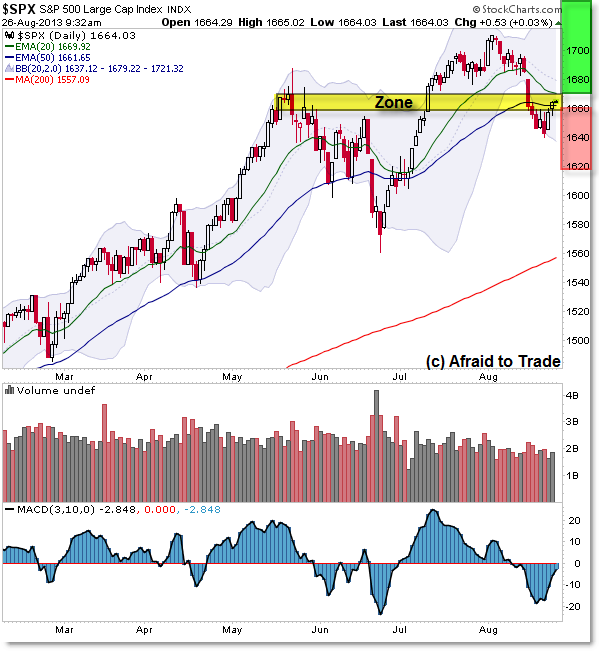
While we are “full steam ahead” on the Weekly Chart (except for the divergences), we’ll focus our attention this week on the overhead resistance cluster as seen best on the Daily Chart:

The 1,660 to 1,675 index level forms a Zone of Resistance, both from price itself (prior highs) and the confluence of the falling 20 and 50 day EMAs (1,670 and 1,660 respectively).
Price is in the middle of this narrow band and we’ll simply generate our trade or strategy planning relative to this level.
A clean, continued upside breakout above 1,670 then 1,675 suggests that we’ll see the weekly chart “open air” kick-in to help propel the market toward – then perhaps above – the 1,700 then 1,710 level.
This would be fueled higher in part by buyers “buying the dip” or adding to existing positions and also by short-sellers rushing to cover losing positions (especially on a break above 1,675 then 1,700 should it occur).
Otherwise, a downside break under 1,660 opens the pathway back to 1,625’s index level for a second “ABC” or three-swing movement to the downside (first swing down; second swing up; third swing down). Reference June 2013 for how this ‘deeper retracement’ pattern may play out again.
Focus on the ‘zone’ and price movement up away from 1,675 or down beneath 1,660 this week.
Join fellow members to receive daily commentary and detailed analysis each evening by joining our membership services for daily or weekly commentary, education (free education section), and timely analysis.
Corey Rosenbloom, CMT
Afraid to Trade.com
Follow Corey on Twitter: http://twitter.com/afraidtotrade
Corey’s new book The Complete Trading Course (Wiley Finance) is now available along with the newly released Profiting from the Life Cycle of a Stock Trend presentation (also from Wiley).

4 Comments
Comments are closed.