Plotting and Planning a Breakout in Priceline PCLN
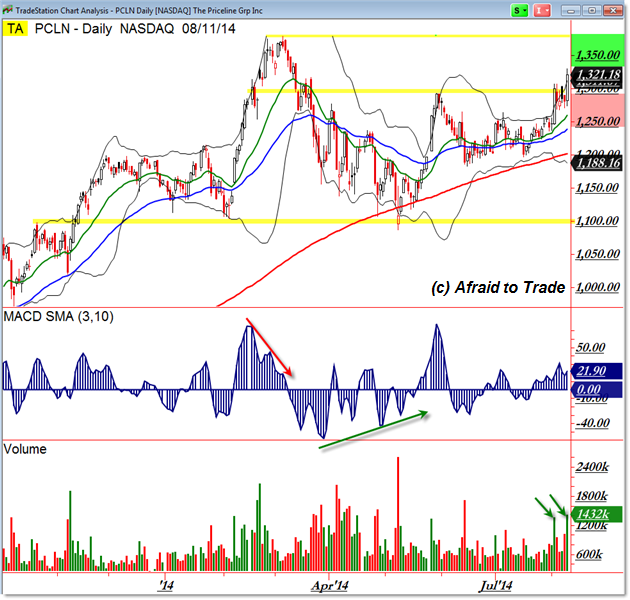
High-flying stock Priceline (PCLN) triggered a bullish breakout signal this morning with a thrust above the $1,300 resistance level.
Let’s update our charts, note targets, and plan a contingency for a possible “bull trap” outcome.
Here’s the Daily Chart with the Breakout impulse today:

A simple glance at PCLN shows a slight sideways trend with consolidation boundaries into $1,100 and the current $1,300 resistance level.
The breakout thrusts price into the “Open Air” zone (no obvious resistance) above $1,300 toward the $1,380 high from March.
The general expectation is that price could continue trading higher in “breakout” formation (see February and May for upside breakouts) toward (or above) the $1,380 level.
We can’t just assume all will be perfect, and thus must take stop-losses or consider playing short for a “failure outcome” or “bull trap” outcome should price stall here and reverse back under the $1,300 barrier.
If so, $1,250 then perhaps even $1,200 could quickly be in play (price tends to move faster through “failure outcomes” than successful ones – where price does what it ‘should’ do).
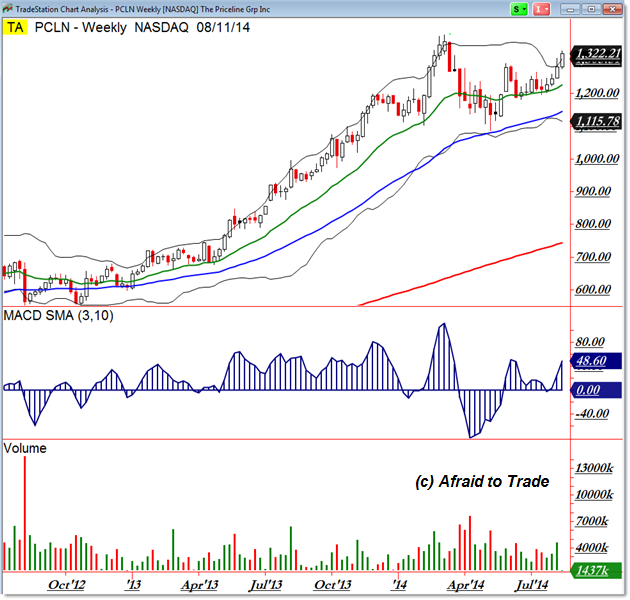
We’ll take a quick moment to step out to the weekly chart:

We see a primary and intermediate uptrend taking place and a clear breakout above the upper weekly Bollinger Band above the prior price high into “Open Air” (the same thing we’re seeing on the Daily Chart).
Again, Priceline remains in the bullish zone above $1,300 (targeting the prior high) and then failure outcome/bull trap outcome should sellers regain the momentum under $1,300.
Corey Rosenbloom, CMT
Afraid to Trade.com
Follow Corey on Twitter: http://twitter.com/afraidtotrade
Corey’s book The Complete Trading Course (Wiley Finance) is now available along with the newly released Profiting from the Life Cycle of a Stock Trend presentation (also from Wiley).

