Pullback Planning from India NIFTY 50 Index May 5
What is the next likely swing (price movement) for India’s “NIFTY 50” stock market index?
Let’s take a look at the Weekly and Daily Chart to plan a likely pullback or retracement pathway.

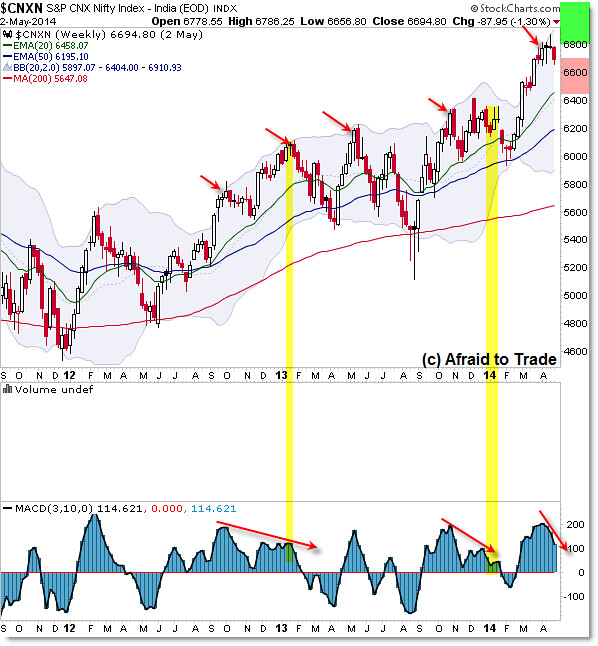
The weekly chart shows an overextended swing from 6,000 to 6,800 with reversal candles into the upper Bollinger Band.
I show prior price peaks – ahead of a retracement or down-swing against the rising trend – with red arrows. Note the outcome of each of these events – with the exception of late 2013, price retraced down toward the rising 50 week Exponential Moving Average.
Curretly, the rising 50 week EMA intersects the 5,200 level but do note a key confluence of the rising 20 week EMA and prior price swing high (resistance) into the 6,400/6,450 index level. We’ll use this as the first or initial downside ‘retracement swing’ target should that outcome develop soon.
Let’s take a look at the Daily Chart and add one more piece of evidence that suggests a reversal is likely:

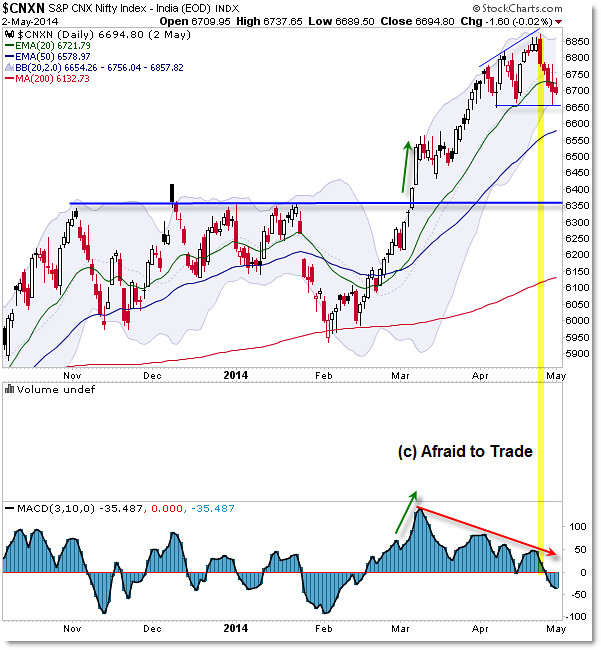
We can clearly see the strong impulse from February to April as the NIFTY 50 Index rallied strongly through a breakout event (above 6,350).
Currently, momentum diverged with price on a multi-swing negative divergence. We also see a “Three Push” price pattern which highlights three small price peaks into 6,750, 6,800, and now 6,850.
Each downswing or retracement increased over time to form an Expanding Triangle style pattern with key support into 6,650. We’ll be watching that 6,650 index level very closely and use it to plan future trades.
A breakdown under the 6,650 level opens a downward retracement or “sell short” pathway toward 6,575, 6,600, then the 6,350 confluence.
Let’s focus on additional downside target levels using an updated Fibonacci Retracement Grid:

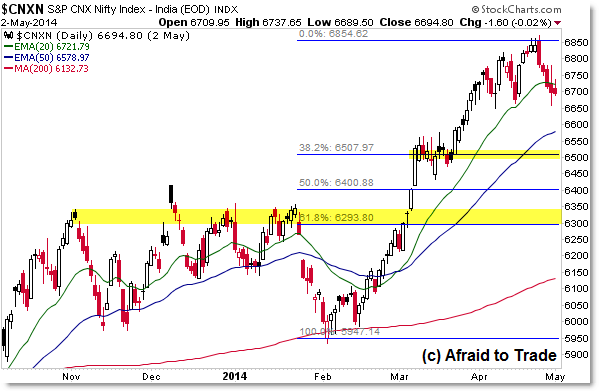
The chart above reveals the short-term Fibonacci Retracement (pullback) levels that can serve as targets – be sure to note confluences or overlap with indicators (moving averages, trendlines) and these Fibonacci Levels.
The 38.2% retracement intersects 6,500; the “halfway” point or 50% level is 6,400, and finally the 61.8% level intersects 6,300 and the 6,350 price resistance level.
The main idea is to expect a retracement down against (away from 6,800) toward one of these lower logical target levels.
The atlerante or “strong trend continuation” thesis calls for a strong support bounce off 6,650 toward 6,850.
Any sudden breakout above 6,850 could generate a ‘short-squeeze’ or breakout bullisih price pathway like that of March 2014.
Again, for now, let a break under 6,650’s support be a sell signal in the context of the Weekly Chart levels (and overextended swing). Look to lower targets.
Focus attention currently on the 6,650 triangle or support level for possible bullish swing off this level.
Follow along with members of the Daily Commentary and Idealized Trades summaries for real-time updates and additional trade planning.
Corey Rosenbloom, CMT
Afraid to Trade.com
Follow Corey on Twitter: http://twitter.com/afraidtotrade
Corey’s book The Complete Trading Course (Wiley Finance) is now available along with the newly released Profiting from the Life Cycle of a Stock Trend presentation (also from Wiley).

