Pure Price Trendline Look at the Recent SP500 Rally Boundaries and Feedback Loop
I often advocate pulling all the indicators off the charts – at least for a few minutes – and taking a ‘price purism’ look at any major price move.
This can give you clarity that others miss, especially if they are caught up in viewing what all sorts of indicators are saying. Indicators are important, but it’s helpful to assess the ‘character’ or structure of the market, which can be obscured by lines and oscillators.
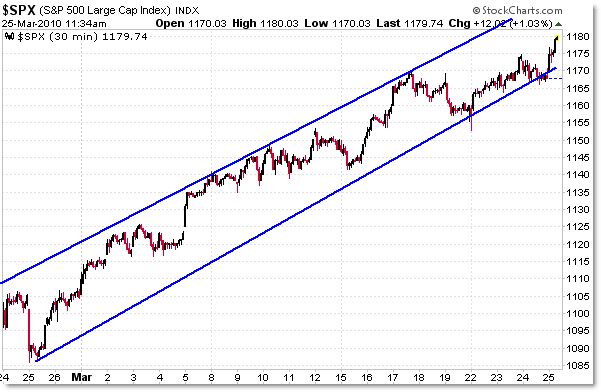
That being said, let’s look at the S&P 500’s daily and intraday chart and note the rather obvious dominant trendlines:

I’ve been highlighting these trendlines in my intraday reports to subscribers in terms of decision support, by saying “As long as price remains within the boundaries, you have two options:
1. Long/Buy
2. Out/Sidelined (if you can’t bring yourself to buy into an overextended market)
A short-sale (for anything other than an intraday trade) is not favored or recommended until price is under the lower trendline.”
We as chartists tend to use intermediate and advanced methods (Fibonacci, Elliott Wave, indicators, etc) to find price targets, resistance levels, and inflection points, and in so doing, it’s easy to overlook the signals from pure price.
Right now, the price is saying – like a mischievous child – “I’m breaking through all your little resistance levels and advanced methods and will continue doing so while I remain within these trend channels.”
The 30-min chart shows these simple “Technical Analysis 101” Trendlines best:

For now, the lower boundary rests at the 1,170 level (off of which price ‘bounced’ yesterday’) while the upper boundary extends to the 1,200 level.
It’s now becoming not only believable, but evident, that at times, price can continue higher in “creeper mode” or “melt-up” mode where a positive feedback loop builds.
What’s a positive feedback loop?
That’s when bulls/buyers are buying (whether from waiting too long on the sideline and getting frustrated as price continues rising) and then higher prices are causing the bears/short-sellers to cover (buy to cover), which drives the market even higher.
So the loop is… bulls buy, bears cover, more bulls buy, more bears cover, even more bulls buy, even more bears buy… and so on until the loop is broken.
The loop is broken either when bulls can’t buy anymore (they have no more capital to buy) or shorts capitulate (there are no more short-sale positions to cover).
Sometimes the loop ends in a climax (think “exhaustion gap”) when traders/investors rush to buy when sellers rush to cover – all at once (instead of slowly, which continues the ‘creeper’ trend).
Granted, it’s not that simple, but it’s often easy to think of it in those terms in aggregate.
Keep your focus on these trendlines and realize that as long as there are bears covering (fear of losses) and sidelined/skeptical bulls buying (greed and fear of missing the boat), the price will keep rising.
Corey Rosenbloom, CMT
Afraid to Trade.com
Follow Corey on Twitter: http://twitter.com/afraidtotrade

3 Comments
Comments are closed.