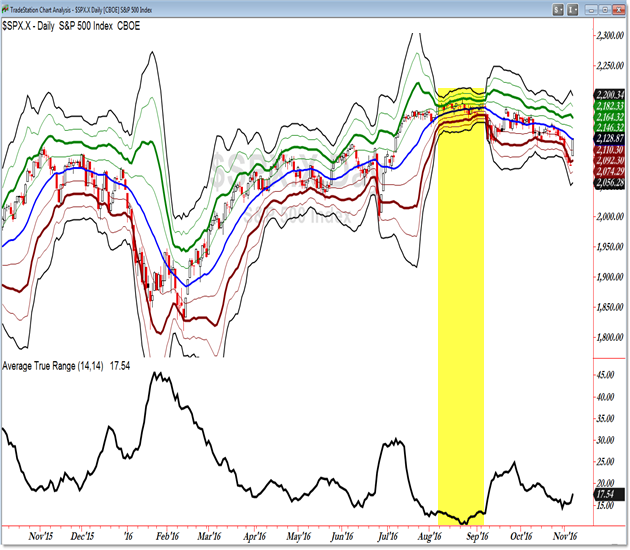
SPX Sigma and Volatility Chart for November
Price cycles between alternating periods of high and low volatility, and if we can assess the current condition, we can have a glimpse into the likely future of the market’s volatility.
What’s the market saying right now as we begin November and finish our election? Let’s see!

We’re seeing a one-year daily chart of the S&P 500 with Sigma Bands (expanded Bollinger Bands which are based on Standard Deviation) and the daily Average True Range (ATR).
Again, we can see the cycle between low (November/December 2015, April to June, 2016, August to September 2016) and then high volatility periods.
Not only does it make sense – given the election – but the market is breaking currently into a higher volatility period as seen by the expanding Sigma Bands and rise in the daily ATR.
For quick reference, the Midpoint comes into play today at 2,128 which is the middle of the volatility range.
Compare the prior November into December period with what we’re seeing now and prepare for a future with slightly higher volatility!
Get these levels in advance with in-depth planning and trading opportunities by joining the Daily Membership.
Follow along with members of the Afraid to Trade Premium Membership for real-time updates and additional trade planning.
Corey Rosenbloom, CMT
Follow Corey on Twitter: http://twitter.com/afraidtotrade
Corey’s book The Complete Trading Course (Wiley Finance) is now available along with the newly released Profiting from the Life Cycle of a Stock Trend presentation (also from Wiley).

