Swing Trading the Rectangle Box in eBay
When studying price charts, it’s important to note historical ‘repeat’ patterns or echoes from the past, which is what we’re seeing right now in eBay shares.
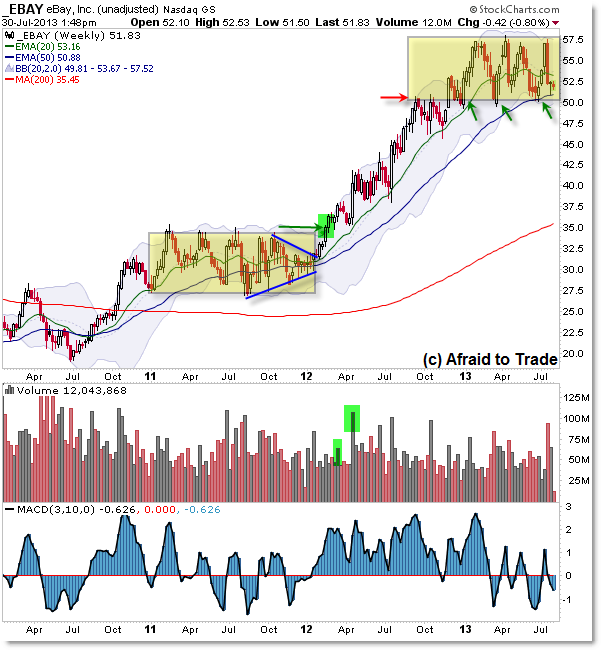
Let’s take a look at a prior lengthy “Box” pattern from 2011 along with the current “Rectangle Range:”

Starting in 2011, eBay shares stalled into resistance at the $35.00 per share level, yet found a base of support into the $27.50 per share level, creating a Rectangle Pattern with a height of roughly $7.50 per share.
It’s a swing-trader’s paradise to trade short into resistance and then long into support, at least as long as the share price continues to “bounce” between these well-defined trendline levels.
Stops are placed just outside the upper or lower Rectangle Trendlines and are triggered in the event shares do breakout of the box – and eventually they will.
Additionally, breakouts from lengthy sideways Rectangle or Box patterns tend to produce profitable long-term breakout swing trading opportunities.
Price trended from the $35.00 per share breakout level to the current Rectangle Range Pattern with boundaries at $50.00 per share and $57.50 per share, also creating a $7.50 Range to play.
With the big picture in mind, let’s drop now to the Daily Chart for a clearer perspective of opportunity:

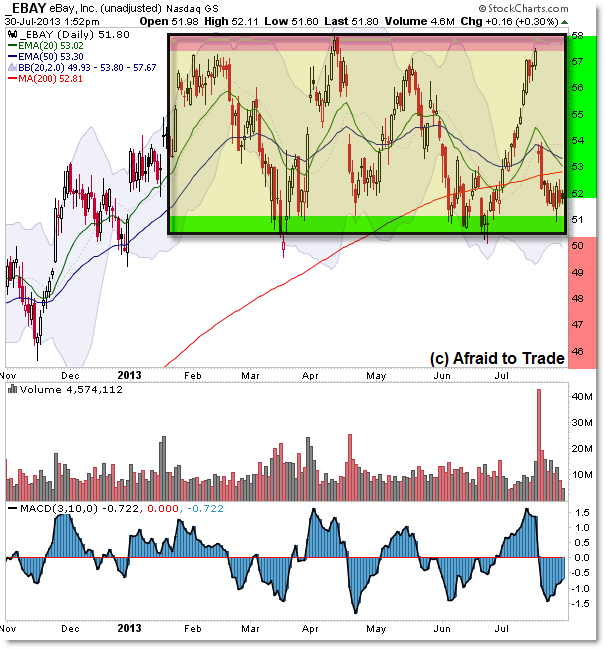
We’ll focus our attention and trade planning on the highlighted Box or Rectangle Range pattern into the $50.00 and $57.50 per share levels.
The Midpiont or “Value Area” of the Rectangle Pattern rests near the $54.00 per share level which is reflected with the sideways or flat daily moving averages.
Moving averages are essentially worthless as trade entry triggers or trade management parameters within a Rectangle or Consolidation Pattern like this – we look to price itself for parameters.
Namely, we’re assessing the probabilities – or trading the outcome – of a test of the upper Resistance Trendline or lower Support Trendline.
Simple strategies include taking long/buy profits into the upper trendline target and considering a short-sale initiated on a movement away from the upper trendline (toward the lower support target).
Stops are placed just outside the trendline boundaries but never ON the boundaries, as the ‘gap-trap’ event on March 18th 2013 reminds us (the intraday low was $49.55).
For swing traders, lengthy and well-defined Range Rectangle patterns like this offer classic “fade” or bounce plays from one trendline to the next.
By contrast, a breakout event (often with one to two closes outside a trendline boundary) can allow for aggressive traders to play the expansion trend movement outside (away from) the Rectangle.
Again, note the outcome from early 2012’s breakout and sustained rally.
For now, create your trading plan parameters for eBay with respect to the ongoing Rectangle pattern, the historical pattern from 2011 (does it continue to echo similarities from 2011 or does the pattern start to differ?), and any sort of breakdown here under $50.00 per share.
Join fellow members to receive daily commentary and detailed analysis each evening by joining our membership services for daily or weekly commentary, education (free education website), and timely analysis.
Corey Rosenbloom, CMT
Afraid to Trade.com
Follow Corey on Twitter: http://twitter.com/afraidtotrade
Corey’s new book The Complete Trading Course (Wiley Finance) is now available along with the newly released Profiting from the Life Cycle of a Stock Trend presentation (also from Wiley).
