Triangle Breakout with Targets for JetBlue Airways JBLU
Uptrending Stock JetBlue (JBLU) broke under a key support level today, triggering an opportunity for traders.
What’s the trading opportunity and target with the breakdown?
Let’s check it out!

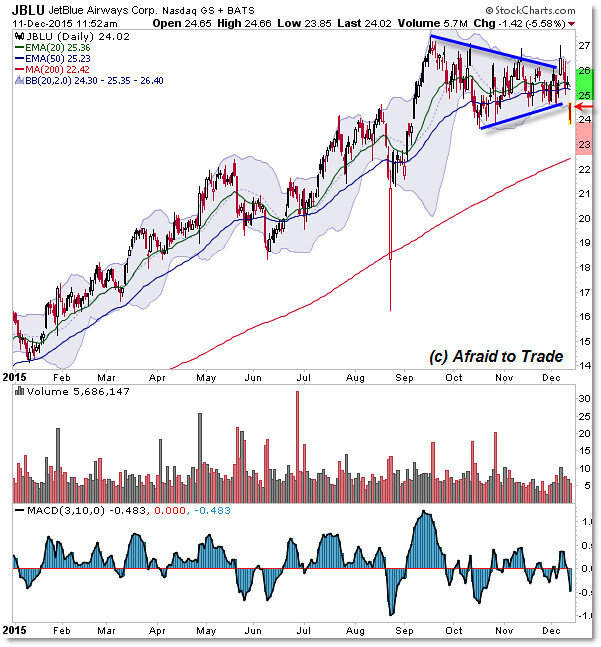
JetBlue Airways (JBLU) continued a very strong trend through 2015, retracing twice into June and August.
September to December saw a sideways trading range (consolidation) that took the form of a Triangle.
The upper resistance and lower support trendlines developed toward $26.00 and $24.50 per share.
Today, we see a gap-down and trend day breakout lower under the $24.50 level on a sudden test of the first support target near $24.00 per share.
The play here – for aggressive traders – is to trade through the bearish “breakout” pathway toward $22.50 (the rising 200 day SMA) or even $24.00 (the price low from August).
Any bearish trade would be overruled or invalid if price suddenly bounces up off $24.00 and re-enters the triangle ($24.75).
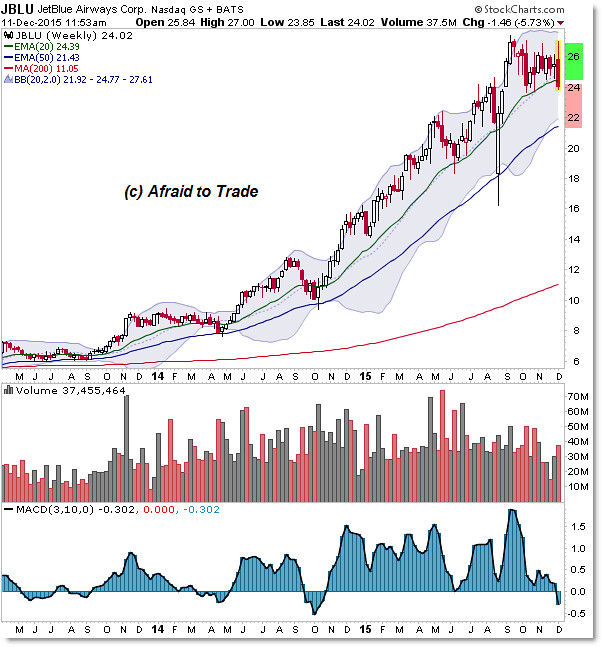
Here’s the Weekly Chart for more targets and perspective:

We see that the strong uptrend began with the 2013 breakout above the $8.00 per share level.
The rising 20 week EMA (green) served as a target for retracements to end and a good spot to enter swing trades into the rising support level that continued with the trend.
Now, we see our first potential threat – or breakdown – under this rising floor of support since late 2014.
An initial break of the rising 20 week EMA opens a sell (bearish) pathway toward the rising 50 EMA.
That target aligns with the lower weekly Bollinger Band near $21.50 per share (roughly $22.00).
Focus your attention – and trades – on the departure from $24.00 and act accordingly if you’re willing.
Follow along with members of the Afraid to Trade Premium Membership for real-time updates and additional trade planning.
Corey Rosenbloom, CMT
Afraid to Trade.com
Follow Corey on Twitter: http://twitter.com/afraidtotrade
Corey’s book The Complete Trading Course (Wiley Finance) is now available along with the newly released Profiting from the Life Cycle of a Stock Trend presentation (also from Wiley).

