Updating Key Levels for Gold in the Breakout
We’ve seen clear relative strength in gold prices over the last week. Let’s take a look at the current Daily and Weekly Chart structure and highlight the key reference levels for trade planning.
We’ll start with Gold’s Weekly Chart:

We’ll start with a possible “Double Bottom” Chart Pattern that developed off the $1,200 per ounce level in the context of a Positive Momentum Divergence.
Note also the Bullish Engulfing Weekly Candle at the start of 2014 which added fuel to the bullish fire. The outcome has been a test – then breakout – of both the falling 20 week EMA and $1,300 round number price reference area.
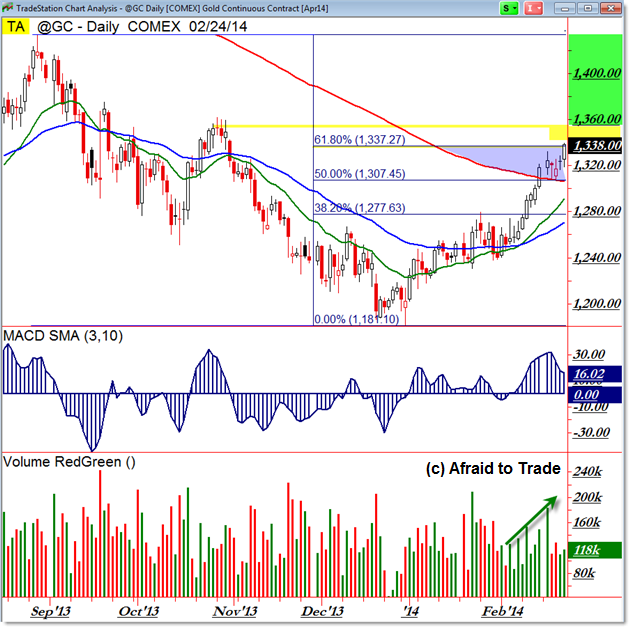
The breakout above $1,300 set in motion a bullish “Open Air” play toward the current resistance cluster near $1,350 which we can see clearer on the Daily Chart:

First and foremost, let’s highlight the prior price high from October 2013 into the $1,350/$1,360 per ounce price level.
We’ll also make note of the 61.8% upper Fibonacci Retracement level as drawn which intersects today’s high price near $1,340.
The other key factor to watch is the blue highlighted region between the falling 200 day SMA (and 50% Fibonacci) with the 61.8% level that is just shy of $1,350.
In other words, price simply continued a strong bullish impulse up off the $1,200 level to trade again impulsively above $1,300 toward our current targets.
The chart suggests that additional bullish price action above the highlighted zone – particularly $1,350 and $1,360 – suggests gold is engaged in a short-term trend reversal that could carry price toward the August 2013 high near $1,450.
Focus on these chart levels – particularly those seen on the Daily Chart – and be on guard for any bearish action on a return under the 200 day SMA reference level that’s intersecting $1,300.
Follow along with members of the Daily Commentary and Idealized Trades summaries for real-time updates and additional trade planning strategies.
Corey Rosenbloom, CMT
Afraid to Trade.com
Follow Corey on Twitter: http://twitter.com/afraidtotrade
Corey’s new book The Complete Trading Course (Wiley Finance) is now available along with the newly released Profiting from the Life Cycle of a Stock Trend presentation (also from Wiley).

