5 and 15 Minutes of Downside Doom in the DIA
Let’s look inside the price action of the 5 and 15 minute chart of the DIA to see the clues preceding the reversal down and also an example of an extremely powerful trend day.
Let’s start with the 15-min structure that I almost highlighted to you last night:
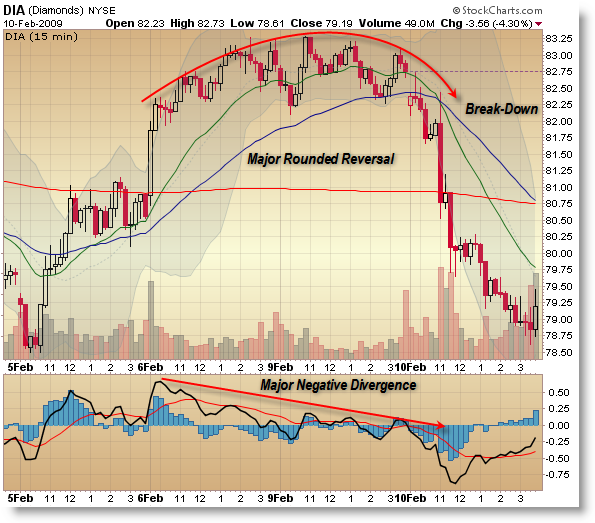
I almost pointed out the “Rounded Reversal” and multi-swing Negative Momentum Divergence on the open blog but decided against it because I believed I’d look foolish doing so as I thought Geithner would reassure Wall Street with his plans and the market would race higher. Well, that didn’t happen, and the market ‘fell off a cliff’ before he was finished speaking today and never really looked back. I’ll keep my political thoughts to myself.
From an educational standpoint, take a good look at the large-scale “Rounded Reversal” and how price followed the script off the reversal and breakdown through the 20 and 50 EMAs – complete with a “Cradle” or Confluence EMA resistance trade at 11:00 EST (how convenient!).
Dropping down to the 5-minute structure gives us the entries and risk points to trade the powerful Trend Day Down:
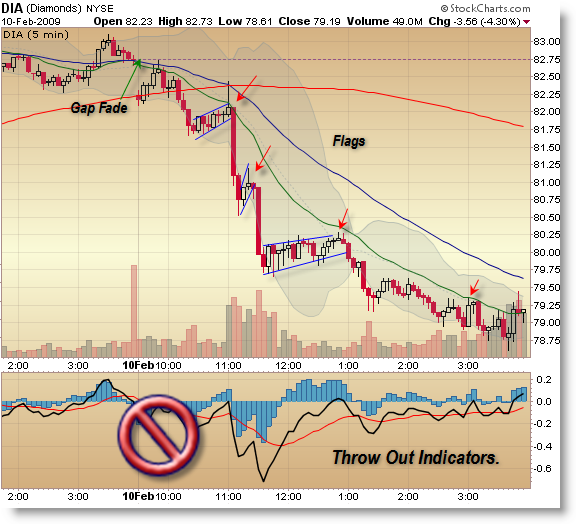
Well, it sure didn’t feel like we’d have a trend day down when the markets opened and filled their opening gap (giving a profitable trade for those nimble among us).
One has to let technicals take a back seat to the major news or announcements – such as a Fed Decision or major policy speech like Geithner gave – but then again, sometimes it’s amazing how accurate they (technicals) can be even in the midst of such rampant volatility.
As Geithner began speaking, we had a bear flag/EMA confluence resistance trade that signaled a short-entry which wound up hitting and exceeding the target literally in 10 minutes. Price formed a two-bar flag (it really wasn’t enough to signal entry) before plunging back down to new lows and forming a second new momentum low.
At this point you should have suspected that we had a Trend Day on our hands and switched off your indicators (you did that, didn’t you?). The only indicator that I’ve found to be useful on trend days is the 20 and 50 EMAs (or your preferred moving average combination). Sell any pullback to the key EMAs.
Seriously – Turn Off Indicators on Trend Days. You’ll save yourself thousands of dollars. Do not read any positive divergences into the latter part of the day. Do not find any buy signals in the stochastic or RSI. Get short and stay short (or get long and stay long on an up-trend day). You’ll thank me later.
Continue studying Tuesday’s Trend Day action for additional clues so you can be ahead of the game when the next trend day occurs.
Corey Rosenbloom
Afraid to Trade.com
Keep up-to-date with the Afraid to Trade Feed.
Follow Afraid to Trade on Twitter: http://twitter.com/afraidtotrade
Corey,
I guess the other message is to turn off the tube! I kept listening waiting for some positive news oe comments to come out and it never did. Just trade what you see. Although as soon as the information leaked out that the Treasury was still considering “options”, the market started a true trend at approx. 11 am central. At that point, if you were quick you could have been in, or else use other entries. The problem with today, was it was news driven, and who knew what would come out of a mouth?
good post
Oh you are so right about indicators. The macd divergence is usually a strong signal, and I took it towards the end of the day. Luckily the stock I was in pulled ahead enough to get out with a little profit, but *phew* never again in this circumstance!
Great analysis.
-Andy
Corey, thanks for the classical analysis. Now, in terms of Elliott, on sp500 , do you think we’re still in wave 2C of 5 or have we embarked upon wave 3 of 5?
Mike,
Good point! I normally don’t watch the TV News but felt I should watch him speak. I actually felt optimistic going into it – I was wrong. I was ready with the buy trigger… glad I didn’t jump the gun. I was shocked. I thought they’d do better than they did. They need to learn to speak to the market and manage expectation. I think one commentator got it right – Geithner overpromised and underdelivered… a recipe for failure.
Andy and Anon,
Thank you for your comments!
Anon,
I’m making it my personal campaign to educate the trading community about the fallacies of indicators on trend days.
I hope people listen.
Anon,
I have two preferred counts, in that we’re finishing Wave E of a triangle (perhaps launching into Wave 1 of 5 down).
The other probably is my preferred count, which is we’re in 3 down of 5 (with Wave 2 being an ABC) and today’s action started Wave 3 down.
Both counts have us going down and breaking November’s lows. I don’t see how that doesn’t happen now. And I had such high hopes for bullishness – that the market may have been making an intermediate bottom. I just thought it was too obvious that we’d be hitting those lows.
Sometimes, the obvious is the right call.
New post regarding double top on SPY, market expansion and buying financials – chartsandcoffee.blogspot.com/2009/02/double-top-vix-long-financials-silver.html
Thanks for your Elliott opinion. Your 2nd preferred count is the only one I had in mind. Hope you can update one of your previous post on the SP count sometime. All the best.
Well done. Less is always more as far as indicators go. Price and volume trump all.
-DT
Anon,
I’m leaning to the “We’re in 3 of 5” interpretation and will try to post that graphically soon.
DT,
Exactly! But it’s so easy for newer traders to ignore those in favor for their favorite indicator, which chops them to death on trend days. It’s hard to know when to ‘turn them off’ and just go with it.
Corey, on the Elliott theme, you’re right, the 4th with an E in progress could also be a possibility, because the overall trend line of 4 is still intact. We’ll see what happens today.
Nasty 2% down move today.
Seeming to hint the possibility for the 3rd of 5th perhaps.
But it could also be just the first break-out of the triangle, beginning the 1st of the final 5th.
Hey, if Elliott were easy, everyone would be using it!
Corey, could you do a post on DIA chart for today 12-Feb-2009? It was a very difficult day to trade. Nasty. I got caught both ways, and I want to hear your take on reading today chart. Thanks.