Update on the Gold Market May 21
Just as I was about to post an update on the Gold Market and the subsequent recent breakout, Adam Hewison also released a video update which I’ll add to this update.

(Clicking the chart opens the video page)
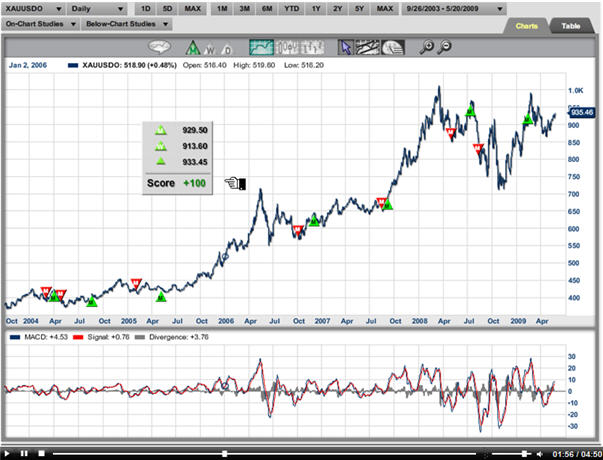
The above chart shows the ‘signals’ from the “Trade Triangle” program from Market Club (members receive these signals on any market or chart).
In his recent video simply entitled “Gold Update,” Adam Hewison discusses an Inverted Head and Shoulders (can you see it on the chart above?) and then gives us an price projection as he walks us through his analysis.
Adam writes: “The gold market sprang into life yesterday (5/20) as it closed in on $940 level which brings it back to its best levels since March 20th. We last looked at the gold market shortly after my return from New Zealand on May 5th. At that time, Gold was trading at $902 you can see that all on my earlier video. Presently we are trading around $937 zone and it looks as though we can see further upside action in this market.”
Take a moment to check out what Adam has to say about gold. I also was going to update you as to my quick analysis on gold, as described in the daily chart below:

Gold is in a confirmed uptrend on the daily chart off the November lows, as evidenced by higher highs and higher lows. We just came off an “ABC” three-wave corrective move into the March lows, March highs, and April lows into support via the 200 day SMA (a major line of defense the bulls were able to hold).
I’ve also drawn a Fibonacci grid off the October lows to the February highs to show the retracement grid gold is showing on its daily chart as well – gold nipped just beneath the 38.2% retracement zone but failed to pullback to the 50% zone, which is a sign of bullishness and strength in an uptrend.
Price just completed a consolidation phase which caused the 20 and 50 day EMAs to converge, giving bulls something to sweat about, but ultimately price has risen back above these levels and now the moving average orientation is in the ‘most bullish position’ possible, giving further confirmation to the uptrend in place.
Price is expected to test the prior resistance high just shy of $975 per ounce, and if buyers can push prices beyond this level (I believe odds favor that they can), then we’ll see an automatic test of the $1,000 level highs and I – along with Adam and others – feel that odds do favor a break above this level to new highs is in our immediate future.
I would be remiss not to give levels to ‘watch out’ for in the event that higher prices fail to materialize, so keep your eye on the $900 level which represents EMA confluence and “round number” support. Should price break this level, watch the $850 level which has held as confirmed support recently, which also houses the 200 day SMA.
In terms of Elliott structure, we could be currently in some form of smaller fractal wave 3 (wave i being the move up off the April lows; wave ii being the pullback to the 38.2% retracement at $875, and wave iii is unfolding currently, which also implies higher prices are yet to come and that we are in an uptrend as the fractals are subdividing into 5-wave affairs).
Let’s keep watching this closely and what it might mean for the other related markets. If the Stock Market begins to fall (retrace) as many expect it will, then it could be a boon to gold as money rotates out of the stock market and possibly into bonds and commodities like gold. Nothing is ever a ‘sure-bet’ so size positions accordingly and monitor critical levels for signs of potential unexpected price weakness.

http://seekingalpha.com/article/133523-gold-the…
http://seekingalpha.com/article/133523-gold-the…