A Look Back on Prior Quadruple Witching Days
Friday brings us the infamous “Quadruple Witching” event which might be a big deal in the market, and it might not. Let’s define the concept and then look back in the past at some recent Quadruple Witching Days.
Options traders know that the third Friday of every month is “Options Expiration Days” which can lead to frenzied activity, volume, and volatility as large funds (and traders) ‘square up’ any remaining open options positions before they expire and settle on Saturday. Perhaps they would prefer not to take posession of a large amount of stock, and so they may unwind hedges and/or sell/buy positions in the options (and stock) market.
Quadruple Witching occurs not only when equity options (like Google, Exxon-Mobile) and index options (like DIA, SPY), but also when futures contracts “roll over” and options on equity index futures (like @YM, @ES, @NQ) expire along with single stock futures options.
The following four components comprise a “Quadruple Witching” Day:
Equity Options
Equity Index Options
Index Futures Options
Single-Stock Futures Options
Often, the result is a rather erratic, volatile trading day that can confuse many intraday traders who aren’t aware of this occurrence. Quadruple Witching occurs on Expiration Friday in March, June, September, and December.
Let’s look back at regular Expiration Fridays and also Quadruple Witching Days in the S&P 500:
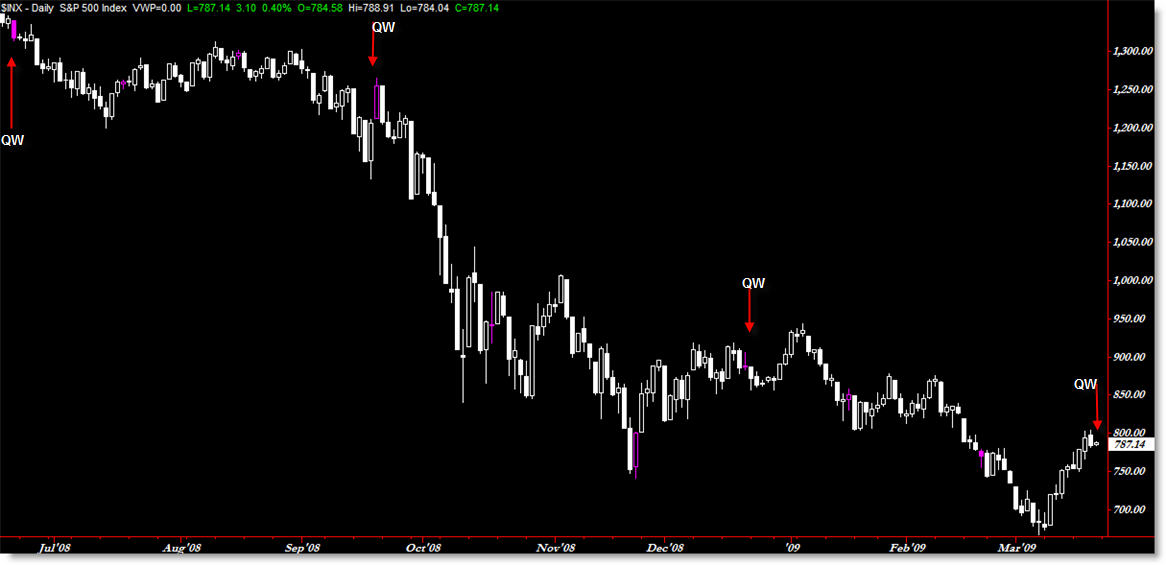
(You’ll need to click the chart for a larger image)
The last Quadruple Witching occurred on December 19th which resulted in a small-range day with volume running only slightly above the average at the time. It was a ‘dud’ in terms of normal Quadruple Witchings.
Prior to that, we had a decent range day on September 19th, with volume surging during the run-up to that Friday as price began its downslide into the October lows. That Friday took many traders by surprise as it was a sudden up-move in a down-swing that only served to delay the inevitable decline.
The first example shown on the chart comes from June 2008, where price formed a Trend Day Down on higher than average volume in the context of a down-swing.
So, not all Quadruple Witching days result in big moves, but the intraday squiggles (price swings) can occur seemingly randomly and not follow the typical expectations of technical analysis. Funds are balancing positions and they typically are looking at their books and not their charts to do so, which can cause seemingly perfect intraday trade set-ups to fail.
So, do trade with caution today but perhaps not with extreme caution. Some retail traders take these days off and start their weekend early. In the end, it’s up to you.
Corey Rosenbloom
Afraid to Trade.com
Follow Corey on Twitter: http://twitter.com/afraidtotrade
Register (free) for the Afraid to Trade.com Blog to stay updated
Hi Corey,
I have noticed volume higher than usual, tape appears to want to consolidate, just wondering what side of the fence you fall into at the moment, are we in the B retrace before another C upleg for a bear rally, if so should we not be buying on weakness?
I’m struggling with S&P almost but not quite breaking 804, which would invalidate the EWC where we’re in 4 of a 5 down starting January. That count seems harder to believe now — seems more likely that if we’re in 4 at all, it’s a 4 of the whole decline. If we’re in a 4, at all.
It looks like we just had an ending triangle yesterday? A fractal 5? Today looks like the first zigzag of a double or triple to me, probably the A of some kind of bigger corrective wave from that fractal 5. But I don’t know if that bigger corrective wave is a B of 4 (bullish next week because next we get a C, but later bearish, because then we get a big 5) or a 2/4 of something bigger up, like, A or 1 (bullish next week because after the 2 we get a 3/5).
But, either one is bullish next week, right? Whether we’re in 2, 4 or B, it seems like another week-long impulse up is coming soon, no?
Jeremy,
Sometimes Quad Witching days wind up as duds. This might be one of them. We’ve already had a big move up this week into which many funds may have already unwound most of their positions they need to.
I have a pretty strong bias that the 800 level will hold as resistance, so whatever wave count is appropriate for that, so be it, but I just feel the Fib confluence at 800, 50d EMA, trendline resistance, prior support is just too strong. I think we inflect back down to test the lows.
I would obviously change my viewpoint if we closed above 805, which I think would surprise a great deal of people.
Kevin,
Technically, that viewpoint is still valid because we haven’t entered W1 territory (W1 ended at 804, but again, I’m not an Elliott stickler).
It’s possible that what I thought was the beginning of W5 was still an ABCDE triangle off the October/November lows but I still view that as a low probability alternate count.
There certainly was a clear 5-wave (fractal) structure up off the recent March lows. I’m not 100% sure how to classify that just yet. It seems logical to call it a zig-zag but that would take us beyond 800, invalidating the “Wave 1” rule.
This week has been interesting due to the Fed and big moves as a result.
Until we close above 805, my bias is that we need a final leg down to test (or perhaps exceed… which appears less likely now) the 666 lows, which would put in a double-bottom and could cause a lot of people to jump in long off the sidelines.
Hey Corey,
I actually learn this pattern from reading your site. We could be forming a 13point ABC pattern on the SPY. I charted it over at my http://www.pikertrader.com, here is the link to the chart though http://2.bp.blogspot.com/_NuJL-LOblQo/ScPO9kAKrHI/AAAAAAAAARQ/i-bv3LfsebM/s1600-h/ABC.png
Pike,
Right on. It might look more like an AB=CD (measured move) than a standard ABC pattern, but the implication is the same – we should be inflecting down off these levels to test the lows and most likely find significant support at those levels.
Good charting!
Hey Corey,
What is a “SINGLE STOCK FUTURE OPTION”?
Brandon
Brandon,
Generally, these were good ideas that never really caught on with the public or even professionals for that matter. Just like you have equity futures (like the S&P 500, NASDAQ), the exchanges launched “single stock” futures to trade the same as equity index futures trade.
But they’re so illiquid and I don’t know anyone (personally) who trades them, but still they exist and make up quad-witching.
Thank you for the respond Corey.
Brandon
You said that the last ten days were a 5-wave fractal impulse, and I’ve been inclined to agree, but I just had a thought: what if that was all of wave 4, and it was really a complex correction, a WXY or a triple zigzag?
In that case we’re in 5 down…
Kevin
Kevin,
That’s my preferred count (that we just began W5 down). Not saying it’s right, but that’s how I’m trading it. I would have preferred to see a cleaner 3-wave structure, but even if this is a zig-zag and we completed a 5 wave A, then we’re in a 3-wave B so I’m still going to try to nab the profit from that downswing.
Thanks. So then, 10:45 AM yesterday through 10:15 AM today was a diagonal triangle type 2 (1 or A), then a little 2 or B until 12:30, now we’re in 3 down of either 3 or C?
Kevin,
Hmm. The easiest count is that we finished an ABC (Wave A was extended) of a Zig-Zag into resistance at 800 and now we’re in 1 of (5) of circled (5) down. The easiest count isn’t always the most accurate count, but it would be nice if that were the count. It would make everyone’s lives so much easier (who follow Elliott).
Also, a Wave C would go up, not down. If this is the (4), then A would be up; B would be back down slightly; C would be back up.
Even not using Elliott, it just ‘feels’ like the next play – or the higher probability play – is down to test the lows to see if we can put in a bottom there (which I think we will) and then price will rally sharply off those levels. It would give the bulls more confidence if we got a double-bottom – it would be all over the TV.
once again, an excellent post
worth noting that expiries can influence trading for the days leading up to expiry …..not just the expiry itself
OK, I follow you. when I said “3 down of 3 or C”, I meant:
3 of 1 of (5) of circled (5) down, which is the first thing you said, or
C of [2 or B] of something bigger up, like (A) of circled (4), or (1) of circled (1) of a new impulse.
Anyway, thanks for all your analysis. You’re awesome.
Reggie,
Exactly. If I were a huge fund, I probably would not wait until the last minute to start unwinding positions.
Most options educators (to the general public) say to unwind most positions a week prior to expiration. Gamma risk increases as we get closer to expiration day.
We saw this week that we had some interesting behavior.