A Monthly and Weekly View of Silver
Analyzing gold may seem difficult for traders, but let’s look at a related market – silver – to see if we can gather any insights from the Monthly or Weekly charts in this precious metal – hint: the picture looks a little clearer.
Silver ($SILVER) Monthly:
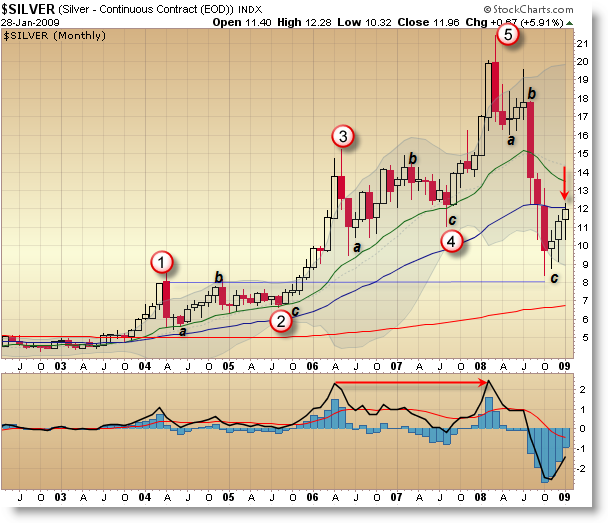
I’ve annotated this chart with a possible preferred Elliott Wave Count so let’s take it step-by-step.
Wave 1 took us to 2004 highs of $8 per ounce before a lengthy, two-year correction held prices in a tight range on the rising 20 month EMA until price broke higher into 2006 when silver doubled to $15 per ounce and then flatlined in an “ABC” flat correction – also supporting at the rising 20 month EMA before embarking on a final up-swing to new highs above $21 per ounce which peaked in Wave 5 in early 2008.
Silver has experienced a sharp correction (much more than gold) in 2008, though we have rallied off prior support at $8 per ounce into the current overhead resistance.
From an educational standpoint, notice the slight negative divergence (flatline) between the 2006 and 2008 price peaks.
Notice further the key resistance coming in at $12 per ounce from the flat 50 month EMA and the horizontal line (not drawn) from prior support at the $12 level. Silver appears to be setting up a low-risk short at the $12 area.
Silver ($SILVER) Weekly:

We see the $12 area again as holding temporary resistance as price formed a doji at the 200 week SMA which is also just beneath the 50 week EMA which should also help contain any price advance. Even if silver were to break through these levels, the higher probability (lower risk) trade is to the downside, as one could establish a tight stop above $13 and play for a minimum target near $9 (for a test of the prior lows).
Adding to the bearish case is the formation of a potential bear flag into these key resistance areas. A break beneath $11 per ounce would confirm the bear flag and trigger the classic entry.
As a caveat… if the Monthly Elliott Wave count is correct, then what we see here as the “flag” could actually be Wave 1 of a new upward impulse and the most likely swing down that could be next would be akin to Wave 2 which – if correct – would not make new lows. Study this on your own to see if you feel this might be the case.
Also, be sure to confirm your analysis on the SLV (Silver ETF) which – as expected – is showing a very similar structure to the Silver Index provided by StockCharts.com.
Corey Rosenbloom
Afraid to Trade.com
Keep up-to-date with the Afraid to Trade Feed.
Follow Afraid to Trade on Twitter: http://twitter.com/afraidtotrade
Hi Corey,
Adding to your analysis- silver historically, during all the previous recessions, has always behaved like an industrial metal and not as a hedge against inflation. This could imply that actually your a-b-c pattern could be seen as 1-2-3-4 with an implication of a 5th wave going below October lows. Let’s see how it unfolds. Cheers!
Indeed!
I almost entertained that possibility on the chart – that the C corrective wave is not yet complete. If that’s the case, then yes, we have one more major swing down yet to go before C is complete. From the structure on the weekly chart, it looks like we could get it in the form of a Bear Flag.
Hi Corey,
I wanted to point out that historically the Gold to Silver ratio is about 15:1, meaning, an ounce of Gold could buy you 15 ounces of silver. Currently that ratio has shot upto about 73:1. Which means, silver has a lot of catching up do. So, even though the weekly charts of silver look bearish, fundamentally, the outlook for silver is very bullish.