A Quick Look at What Else Happened on Today’s Fed Day
While most people will likely be focusing on the wild intraday volatility in the S&P 500 (or other stock market indexes), let’s take a quick look at how Crude Oil, Gold, and the Dollar Index (continuous futures contracts) fared with today’s Fed announcement.
It’s a quick study in intermarket relationships.
First, the S&P 500 e-Mini (@ES) Continuous 5-min chart:

The S&P 500 surged after the initial release… and then collapsed further and faster than most people expected – failing at a new 2009 high. The peak to trough move was 20 @ES points or roughly 2%.
Next, The US Dollar Index (@DX) 5-min:

The Dollar is currently inversely correlated with the S&P 500, meaning the Dollar plunged initially… then rallied sharply into the close (as the S&P 500 fell).
The Dollar Index made a fresh 2009 low then bounced off the critical (and ‘line in the sand’) support zone of $76 in the index.
On to mini-Gold (@YG) 5-min:

The mini-gold contract – which is roughly/loosely positively correlated with the stock market – also surged initially… then plunged into the close. Gold did not make a new 2009 high today (though it wasn’t far away).
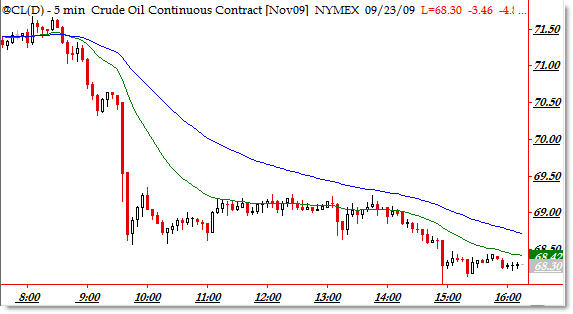
Finally, Crude Oil (@CL) which didn’t seem to be affected by the other volatility in the market:

This market surprised me today. From the NYSE Open, Crude Oil plunged from $71.50 down to $68.50 per barrel before forming a tight range-bound day and having virtually no reaction to the Fed Decision though price did drift lower with the stock market and gold.
Crude Oil is generally positively correlated currently with the S&P 500.
The morning plunge was attributed to larger inventories, but usually cross-market currents form ripples when something as large as the Fed Announcement takes hold.
This mainly shows intermarket relationships and reactions to a large external stimuli (Fed Day).
All charts are created with TradeStation using continuous futures contracts – times are in Central Standard Time.
Corey Rosenbloom, CMT
Afraid to Trade.com
Follow Corey on Twitter: http://twitter.com/afraidtotrade

Does this sound like try to hold on to the end of the month(mabee is won't sell off to hard)
THe measure rule you posted yesterday on AIG worked for the FOMC pop. check the chart.
Boy, yesterday certainly appears to have been one of those days where a confluence of events finally shook the confidence of the bulls.
I wanted to offer further comment on light crude; After a solid bounce from the August 2008 lows, Oil hit a major level of resistance at about $73.50. Since June 0f 2009, it has been consolidating in a narrowing range and forming a very clean triangle. The lower bound of this triangle is comprised of a upward sloping trend line that originated in March of 2009 and has had many touches since. It's importance is significant and relevant.
Yesterday, that trendline appears to have been violated; price broke below $68.80 and closed near $68.30. If price can not regain the trend line it is a bearish picture for oil!
Projecting price from the initial swing within the triangle($73.50 – $59), a move of $14-15 could be anticipated. From the triangle trend line break at $68.80, it would point towards a pull-back target range of $54.80 – 53.80.
This price projection target becomes more relevant since price hit major resistance at $55 on it's move up. That resistance now offers support to a retracement move.
Worth watching oil closely over the next several trading days.
Looks like oil is going to ride the b band. Have a great trading day Corey.
Cheers,
Dan