Bullish Elliott Wave Fractals on the US Dollar Index Oct 18
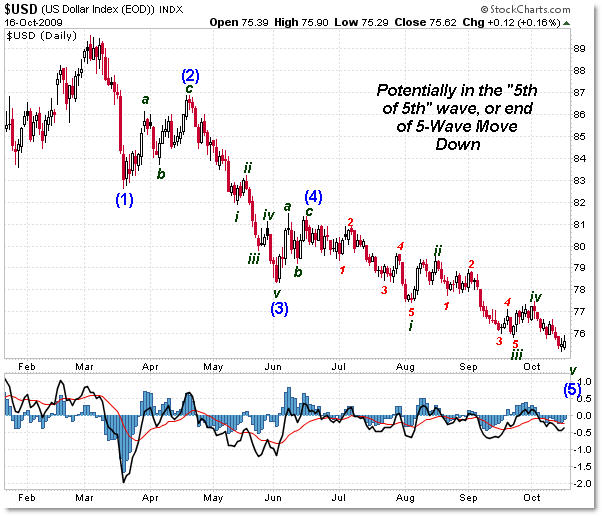
There’s very interesting internal wave counts on the US Dollar Index shaping up right here. Let’s take a quick look at a potential Elliott Wave daily count on the US Dollar Index:

What interests me about this count is the internal divisions or fractals of each larger-scale wave. This is just a fractal of the larger picture, but follow price’s 5-wave move down from the 2009 highs shown here to the recent lows.
Not only do we see a blue 5-wave decline, but I’m showing the fractals that comprise each of the blue waves… and the most recent fractals have their own internal five wave patterns.
The quick implication is that we need to keep watching the US Dollar Index very closely for any signs of life to clue us in that the 5-wave fractal move may be complete. A break above $78 would be a confirming variable that could occur soon.
Also, notice the lengthy multi-swing positive momentum divergence that has set-up under the price action, which serves as a momentum non-confirmation of the lower prices.
This chart, and deeper analysis, is pulled from this week’s “Weekly Intermarket Technical Report” which is a 22 page multi-market, multi-timeframe analysis of the 10-Year Note, S&P 500, Gold, Crude Oil, and US Dollar Indexes.
I mentioned in the report that we’re seeing a distinct battle between the basic/introductory technical analysis vs the intermediate/advanced level analysis – more specifically from “the trend” (clearly bearish) vs a 5-wave fractal decline into a lengthy positive momentum divergence (hinting bullish or at least a non-confirm of the downtrend).
Fascinating cross-roads. Let’s watch this development very closely in the weeks ahead.
Corey Rosenbloom, CMT
Afraid to Trade.com
Follow Corey on Twitter: http://twitter.com/afraidtotrade

Thanks for the article Corey! The more dollar bears get even more bearish out their the more bullish I get. As I said before, bring on the high US dollar so we can make the quick money shorting commodities. If we're lucky it will be easy money. Come on, which trade doesn't want an easy pay day.
Come on, which TRADER doesn't want an easy pay day
I have been studying the dollar up ETF (UUP) chart, and it looks like it has just about reached the February and July 2008 lows, which is also the 100% retracement from the November 2008 highs. I would think this is a logical point to end its downtrend.
Great highlight of the $USD EW count Corey. Due to the scale of the upcoming Primary wave 2 (circle) bottom expected in the upcoming days / weeks at the end of (5) of (C), technicians should remain vigilant for two distinct possibilities in the character / temperament of price action: either a sharp penetration of the downtrend channel within wave v (circle) that breaks 75 and targets a cluster of support at 74.50 will complete the fifth of a fifth ending diagonal; or it will complete with a rather anti-climactic crawl towards the 74.50 finish line in which average true range and short-term volatility continually contract into a marked inflection point.
Based on price extensions and time symmetries, a sharp ending diagonal would complete itself over the next few days, ideally with an abandoned baby, morning star or similarly bullish trio of daily candles; whereas a drawn out ending diagonal would grind to completion in a series of various dojis and failing hammer candles over the next two weeks. However this fifth of a fifth ending diagonal is ultimately resolved, EW confirmation occurs upon a break of the Oct. 2 wave iv (circle) high of 77.48.
In the interim between a possible bottom and confirmation therein, technicians can look for two specific changes that would be characteristic of a significant dollar bottom: one, a series of unabashedly bullish candlestick patterns such as an advance block or three white soldiers that would signify a dynamic underlying change within price action; and two, a rapid re-expansion in average true range and short-term volatility that would signify the end of a corrective period and the start of a Primary wave 3 (circle) impulse. By analyzing candlestick, sentiment, volatility and volume patterns as well as market internal signals, EW practitioners can more effectively diagnose the viability of their counts and anticipate inflection points. This comprehensive approach to technical analysis is especially valuable during patterns such as a fifth of a fifth ending diagonal where momentum oscillator divergences abound.
Looks like we've broke last weeks low. BUT, we can make a quick scalp trade off silver or gold.
Cheers,
Dan
Since the USD is moving inversely, but in concert with gold, silver, oil and the equity markets; one would expect the Elliot Wave counts in these to align and show close similarities, but inverse directionality. While the counts can often get confusing, multiple indices moving in concert and having similar wave characteristics, provide enhanced clarity.
Good summation of the dollar chart. What I see is an ABC from June 15 to Aug 5, followed by an ending 5 wave impulse pattern. Basically it's a 3,3,5 wedge (or ABC really) from June 15th. I have UUP at 22.25 before reversing. Wed or Thurs may be the top for everything but gov bonds. Let's make some money.
marc