Euro FXE Update Shows Weekly Confluence Level to Watch
A lot of traders have been paying attention to the Dollar, but it’s also important to watch the Euro and what’s taking shape on its respective price charts.
Let’s take a quick Weekly then Daily look at the Euro-trust ETF – FXE – and reveal a weekly confluence level to watch, and a possible daily bull trap to keep an eye on.
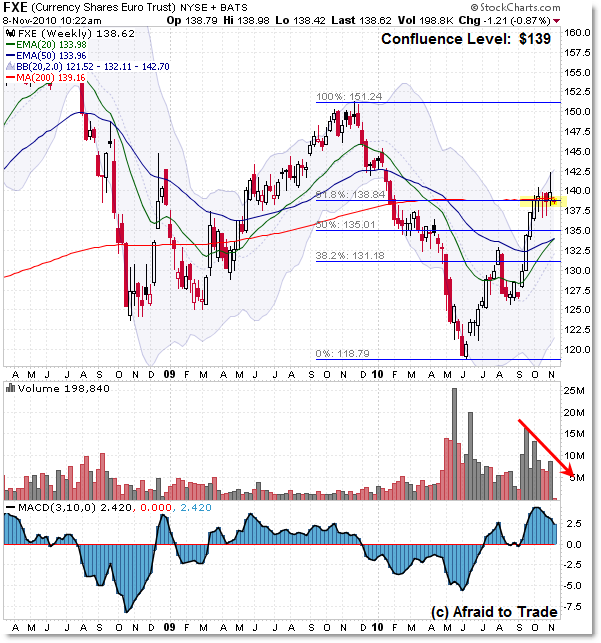
First, the FXE Weekly:

Cutting through the chart to what’s most important right now – there is a key indicator confluence at the $139 per share level (which is roughly 1.39000 in the EUR/USD pair).
We’re still at the $140 level, which I updated previously in “Daily Chart Price Target for the EUR/USD Pair” (which addressed the EUR/USD and the 1.4000 level – which has so far been a wall of resistance).
So as of now, at least on the FXE chart above, the 200 week SMA rests currently at $139.16 while the 61.8% Fibonacci Retracement as drawn is $138.84.
This forms a simple dual convergence at $139 – just shy of the all-important $140 level.
What happens here at the $140 level will be key to the future – a pause here (meaning resistance holds) implies that the Euro will begin declining – and thus the Dollar start rising – which could indicate a pull-back in stocks, gold, and oil in the short term.
And of course the opposite is true – a price breakthrough above $140 suggests this rally remains strong and that the Euro will continue its rise, Dollar continue its fall, and thus stocks, oil, and gold will similarly continue their rallies above their resistance levels (for example, 1,228 in the S&P 500 and $87 in oil).
In simplest terms, what happens here is key – particularly if a Bull Trap just sprung.
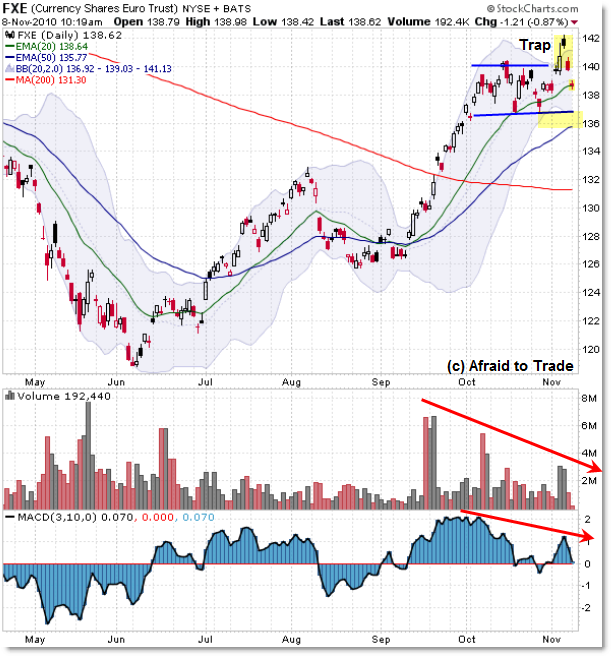
Now, let’s drop to the Daily Chart:

I’m highlighting a negative volume and momentum divergence, but only as chart facts at the moment.
Beyond that, we have a sideways rectangle consolidation at the $140 level (technically $137 to $140) which price broke to the upside last week.
Unfortunately, as of this morning, that breakout has failed in what might be developing into a Bull Trap. It will officially be a Bull Trap if price continues its decline and breaks under the lower trendline at the $137 level.
Speaking of that, we have a mini-dual confluence of support at the $137 level that is important to watch. It’s the horizontal trendline and the 50 day EMA (currently just shy of $136).
So, to make it even easier to keep score, a break back above $140 triggers a range breakout play in line with a positive breakout in the weekly chart.
However, anything less – particularly if the fund breaks under $137 – would be a bearish development that could argue for a cross-market reversal (down Euro, up dollar, down stocks, down gold, down oil).
I speak more about these sort of cross-market levels, structure, and opportunities in the weekly reports to members.
So, Euro bulls need to watch the $140 level for a price breakout that could lead to another leg up, while Euro bears need to watch the daily chart dual support level at $137 for a downside break which could lead to a new leg lower to $132 at least.
Either way – watch these levels closely whether or not you trade the Euro.
Corey Rosenbloom, CMT
Afraid to Trade.com
Follow Corey on Twitter: http://twitter.com/afraidtotrade

I like your charts, I came up with something similar on a EUR/USD chart. I have the levels for my lines at 1.4079 and 1.3733.
Good analysis, but I'm not seeing your charts (they may be blocked by my institution?). I think will see more downside in EUR as debt worries renew and I agree that 1.37 will be key.