Quick Charting the EURUSD Daily Measured Move Price Target
One of the main themes recently in the FOREX market is the weakening of the Dollar relative to other currencies.
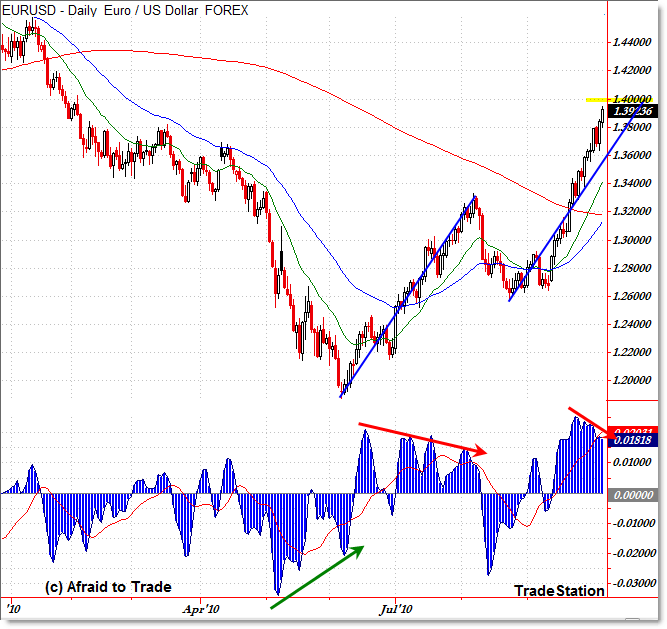
Let’s that a quick chart-peak at the 2010 move in the EUR-USD FOREX Pair and note key resistance levels broken and a potential “Measured Move” price projection target that is due to hit soon… and pay attention to whether this resistance level holds, or shatters to reveal further upside targets for the Euro.

Let’s take it one step at a time.
The main idea I’m showing is the “Measured Move” or more commonly known “Bull Flag” price pattern projection as shown with the angled rising blue lines.
The theory goes that if price makes a “measured move” like a bull flag, you can project the distance from the first “pole” or move of the flag when added to the bottom of the flag (the 1.26000 level in this case) to arrive at a potential overhead price target to play for.
If so, that would make the target roughly 1.40000 which is almost where the pair is trading now.
So, if that price pattern is dominant, then we could see a pausing of the recent upward move in the Euro.
Of course, there’s bigger factors going on than the charts – as in broad-based currency devaluation, particularly in the United States (Dollar) and Japan (Yen), so that reality may very well trump price pattern ‘idealism.’
If we see a move above 1.40000, then it will clue us in to the Measured Move price pattern failure and suggest that even higher price targets are yet to come – including the potential for a retest of the 2010 high at 1.44000.
Beyond the price pattern, I wanted to make a couple of quick comments from a chart purism standpoint:
Bullish: The Euro/US Dollar pair is cleanly above the 200 day SMA (red line) and the EMAs are about to cross into the most bullish orientation possible (20 over the 50 over the 200). That’s a big deal.
Bearish: There’s a short-term negative momentum divergence that has developed – similar to stocks – on this recent rise. The last time we had a negative divergence resulted in the August pullback (more of an ‘ABC’ move than anything serious).
Bullish: The pair crossed above two prior price peaks from March and April, so the breaking of those resistance levels recently adds to the bullish camp.
For now, keep focused on what happens at 1.40000 for clues to whether to expect at least a temporary pause… or a continued higher Euro relative to the Dollar.
Corey Rosenbloom, CMT
Afraid to Trade.com
Follow Corey on Twitter: http://twitter.com/afraidtotrade

EWI has analyzed this long term as an A-B-C Correction in the Euro, and it seems to have held so far today. Low price target in the dollar was almost hit.
That's another way to label the “flag” or measured move pattern as a simple “ABC.”
A breach above 1.40000 argues for this as a 1,2,3,4,5 (being we're in the 3rd wave up) as opposed to the simple, terminal ABC so we'll see which scenario plays out in the coming months.
Sir ,
can you suggest some websites which publish dow/s&p technicals on a daily basis which you felt have been accurate !
Thanks.,
Lori
I trade this pair.
thank for sharing