Ford F Flags Down to the Lows in Bearish Breakout
If you’re a big fan of technical analysis and bear flags like I am, you’ll love Ford (F) right now.
We’re seeing price in a downtrend rally toward a critical resistance pivot in a Bear Flag… and then break (collapse?) beneath the trendline this morning after falling from the resistance pivot.
It’s a great lesson and perhaps a better trade set-up right now. Here it is:
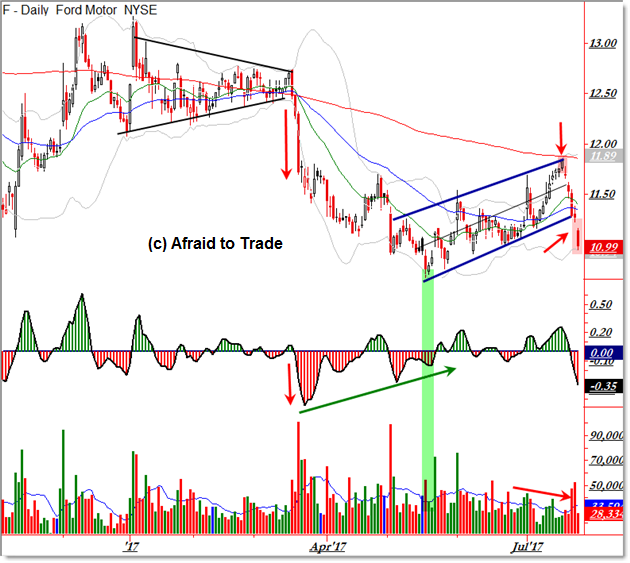
On a separate lesson, a Symmetrical Triangle developed in early 2017.
Note how volume declined as the pattern formed – that’s a textbook pattern example.
Price ejected beneath the lower trendline, setting up a Breakout Trade that was wildly profitable for bears/short-sellers.
In May after price completed a sharp liquidation phase, buyers stepped up their game, bouncing price higher up away from the $10.00 per share level on a persistent positive momentum divergence.
Green volume and momentum surged on the initial breakout , but look what happened next.Momentum and Volume both declined – diverged negatively – as price rallied up toward the underside of the falling 200 day SMA (red line).
This critical “Make or Break” pivot was an excellent aggressive short-sale trade set-up – a retracement.
See our “Perfect Pullback/Retracement” Lesson Bundle for specifics on recognizing and trading this excellent opportunity.
From there, price collapsed toward the lower rising trendline (initial swing trade target) beneath $11.50… and today we see a bearish breakout beneath the rising (lower) trendline, triggering a breakout entry.
Watch price on the current departure from the $11.25 pivot. Stops are placed back inside the pattern near $11.25 (which makes it the critical pivot at the moment).

Follow along with members of the Afraid to Trade Premium Membership for real-time updates and additional trade planning.
Corey Rosenbloom, CMT
Follow Corey on Twitter: http://twitter.com/afraidtotrade
Corey’s book The Complete Trading Course (Wiley Finance) is now available along with the newly released Profiting from the Life Cycle of a Stock Trend presentation (also from Wiley).”