Are You Following this Stellar Parabolic Arc in INTC
If you haven’t charted or traded Intel (INTC) in a while, you’re missing an amazing “arc trendline” or exponential rally pattern.
Let’s take a look at the pattern, compare similar examples, and plot a potential future for this newly high-flying stock.

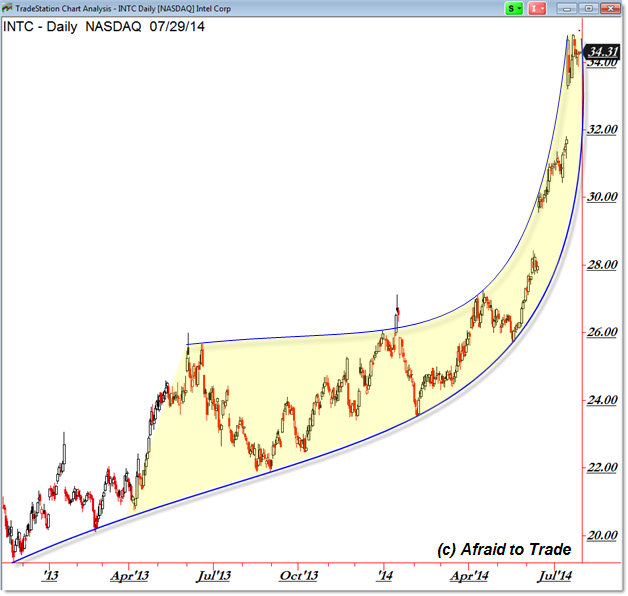
I wanted to start with a pure-price trendline view of the exponential growth (rise) in INTC’s stock price.
Starting with the late 2012 low, price began a new uptrend that developed a stable rise that culminated in mid-2014’s parabolic trendline arc.
These patterns are usually dangerous and deceptive and draw new traders into the raging river of a straight-up price movement.
As professionals or experienced traders can tell you, these patterns rarely end well for the buyers.
Nevertheless, these patterns often continue longer than most traders expect and in the process, they can devastate the accounts of the (eventually correct) short-sellers or bears.
The general outlook is to follow price or trade aggressively within the upward rise ahead of a likely reversal.
Short-sellers should avoid the stock until it breaks through the rising vertical trendline which currently overlaps the $34.00 per share level.
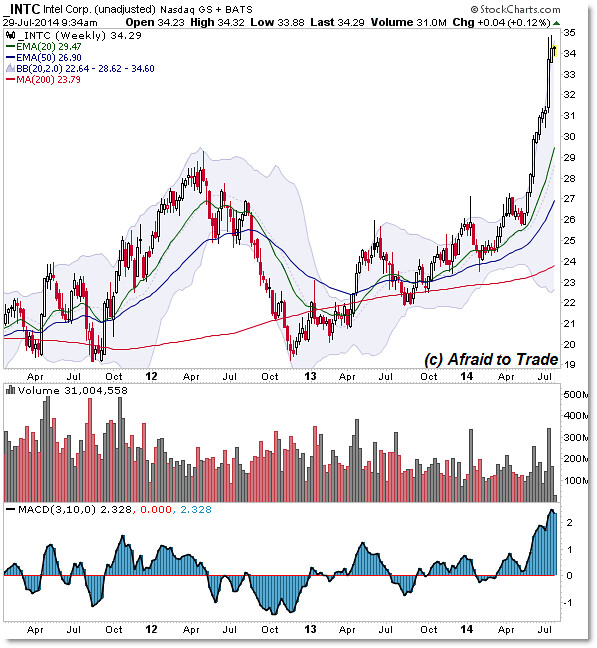
Here’s the Daily and Weekly Chart for additional perspectives of the parabolic rise:

Intel (INTC) Weekly:

I’ll leave the rest of the commentary to you to compare the typical Intel price movement (which is relatively low volatility in a stable stock) to the recent straight-up momentum occurring in mid-2014.
If you enjoy playing reversal patterns, look for a break under $34.00 that carries under $33.00.
If you’re an aggressive bull currently long Intel, do be cautious, trail stops closer, hold on tightly for any additional potential “parabolic” price gain that may occur, and don’t hesitate to take profits on a breakdown under $34.00 and especially $33.00.
Please also view any number of prior posts in the blog archive on this topic – and update these with “what happened next” charts:
“Interesting Arc Pattern forming in Harley Davidson (HOG)”
“Charting the Long-Term Parabolic Arc Trendline in the S&P 500 since 2009?
“Strength in WYNN and the Parabolic Price Arc“
“March Crude Oil Structure and One of My Favorite (Arc) Patterns”
“March Check-up on (Intraday Arc Trendline) Internals at the Highs”
“Arc Trendline on the Weekly US Dollar Index (still in motion)”
“Key Inflection (and Arc Trendline Lesson) in Apple AAPL” (great lesson)
“The Dominant “Arc” Trendlines to Watch this Week in Gold“
“Intraday Rounded Arc Playing out (SP500)“
Lesson in Trading Intraday Arc Trendline Breaks/Reversals
Follow along with members of the Daily Commentary and Idealized Trades summaries for real-time updates and additional trade planning.
Corey Rosenbloom, CMT
Afraid to Trade.com
Follow Corey on Twitter: http://twitter.com/afraidtotrade
Corey’s book The Complete Trading Course (Wiley Finance) is now available along with the newly released Profiting from the Life Cycle of a Stock Trend presentation (also from Wiley).


Am aflat aceasta pagina, dupa ce am cautat despre
Are You Following this Stellar Parabolic Arc in INTC pe Google.
Se pare ca informatia dvs e foarte valoroasa, mai ales ca am mai gasit aici si despre intc,
ora exacta, lucruri interesante si folositoare.
Mult succes in continuare!