Fun Intraday SPY Fibonacci Confluence Grid Feb 8
It’s hard to come up with a good title that gets you to read a post about “Fibonacci Confluence,” but it’s an important and useful tool you can learn – if you haven’t already – that can help you uncover possible targets for intraday traders to play for, and also areas of hidden resistance (or support) that sets up a reversal trade when combined with other indicators.
Let’s take a look at today’s Fun Fibonacci Confluence in the intraday SPY.
The 15-min chart sets up the grid we used today:
To find hidden Fibonacci Confluence zones (for overhead resistance), start with a key swing low and then look backwards to at least two (preferably three) immediate swing highs in the downtrend.
Draw standard, no frills Fibonacci Retracements grids to each of these swing highs.
Then, observe any levels of confluence (overlap) in the retracement grids, as shown above.
That’s all there is to it!
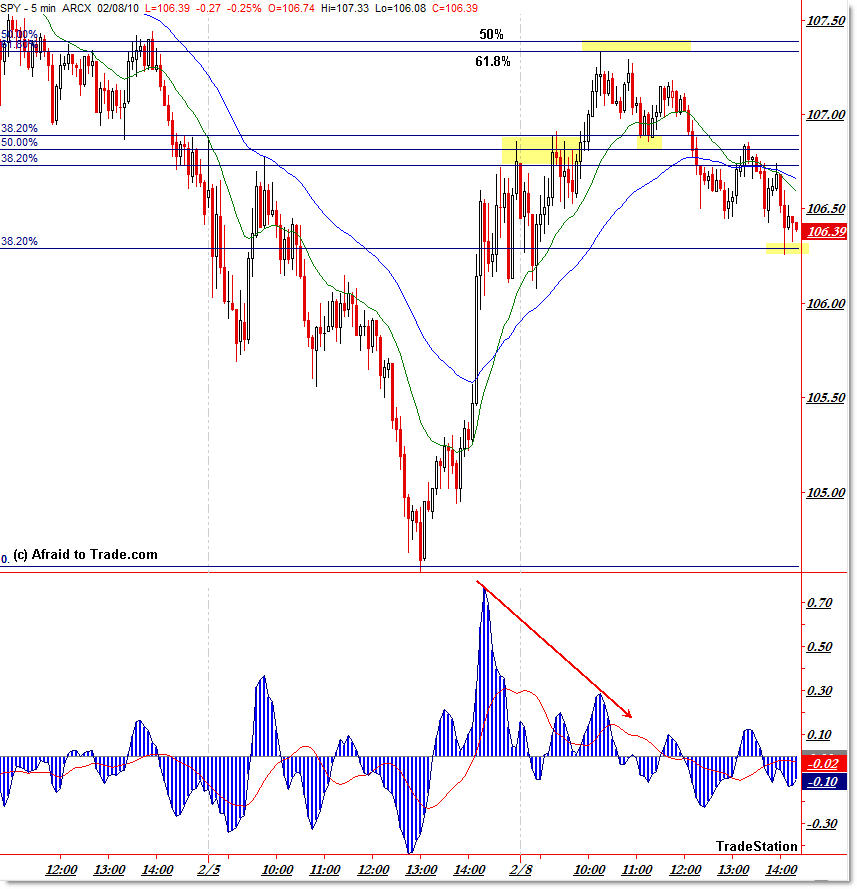
The first level of resistance off Friday’s lows came in at the $106.75 level, which held price for a time both at the close on Friday and early this morning, giving nimble traders opportunities.
The second level of resistance was the $107.40 area, which was Monday’s intraday high.
Traders could have bought long and exited as price touched these levels, and then considered getting short if lower timeframes showed sell signals (like reversal candles or negative divergences).
It turns out we did see negative structure heading into this $107.40 confluence area – let’s see it.
Intraday 5-min SPY trading grid and Oscillator:
I’m showing the 3/10 Oscillator which marked a distinct negative momentum divergence that formed as we made new highs mid-day Monday – that’s a non-confirmation and a very bearish omen as we rally into any sort of overhead resistance level.
It gives nimble (aggressive) traders a chance to enter short close to the resistance and place a tight stop perhaps beyond $107.50 to play for a small retracement at a minimum (short) or a potential full swing reversal to lower support levels.
Before the close today, we had already fallen $1.00 off the intraday high and the confluence resistance level shown above.
There’s no way to know if a certain level will hold, but you can help put the odds in your favor by looking at non-correlated methods (such as momentum divergences, internal divergences such as TICK, reversal candles, and other methods).
I enjoy using Fibonacci methods because they help give targets and levels to watch as price comes into these zones. It’s often very neat when a Fibonacci level intersects with a daily Pivot level… but that’s another story!
That’s the idea of my Idealized Trades daily service, which explains these professional strategies in more detail each day for intraday traders.
Today gave a great textbook example of this concept and it’s helpful to learn these “Fun Fibonacci” lessons whenever possible.
Corey Rosenbloom, CMT
Afraid to Trade.com
Follow Corey on Twitter: http://twitter.com/afraidtotrade


To Corey,
You are awesome at explaining T.A. Would you be incline to give an example when Finbonacci levels intersecting with Pivot levels soon? Very curious to what occurs at those particular levels. Thanks.
Thanks Beantown trader!
It's just another level of confluence – what we're looking at is not magic levels, but levels that can cause traders to act, sort of like self-fulfilling prophecies. That's why confluences are more important than single levels because more traders who use diverse methods combine to take the same action (exiting with a profit or putting on a new position) when price hits their level as indicated by their favorite indicator.
So, sometimes great moves come with a long term and short-term Fibonacci level intersect a daily pivot line. That unites three different strategies.
Never tells us exactly what will happen, but puts the odds in favor of a reaction occurring there.
If not, then the stop is close.
Elliott Wave counts worked today as well. Looking forward to seeing if your counts were the same as mine in tonight's Idealized Trades.