Gold’s Breakout Zones Trapped Between Support and Resistance
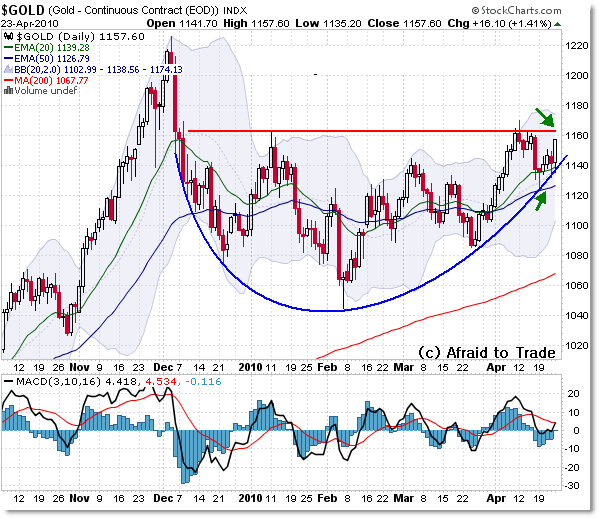
Gold prices are in a peculiar position – at least on the daily chart – in terms of short-term price resistance and indicator support.
Gold can’t stay between these levels for long, so it might be helpful to know them in advance of a breakout either way.
Let’s take a quick look at the levels to watch for the week ahead in gold:

The overhead resistance level rests at $1,160 which is a price resistance zone as shown above (red line). There is ‘open air’ to the prior high at $1,225 on a break.
However, we haven’t gotten above that level yet – at least by the weekend – so watch $1,160 in the week ahead.
What about support?
There’s plenty of it on the daily chart.
First, we have the ‘arc’ trendline from which we bounced last week – it’s currently at the $1,140 level.
Otherwise, we have the 20 and 50 day EMAs – which haven’t been much help for the duration of the trading range (rectangle) in 2010. For now, they rest at $1,140 and $1,126 respectively.
If the pattern is an ‘arc’ or ’rounded reversal,’ then we’ll likely see $1,225 in the weeks ahead, but if the pattern continues to be a rectangle, then we’ll see a move back down to test the $1,080 level potentially.
Per Mark Douglas’ teachings, we need to find key support and resistance areas as inflection points, because the market is either going to have to break them or stay within them. We manage risk and opportunity accordingly.
For full analysis on the higher timeframes in gold, along with an ‘inter-market approach’ of 10-Year Notes, the S&P 500, Crude Oil, and the US Dollar Index in a 22+ page weekly report, check out our Weekly Intermarket Premium Memberships.
Corey Rosenbloom, CMT
Afraid to Trade.com
Follow Corey on Twitter: http://twitter.com/afraidtotrade

Cory, what is your take that this s an IHS, we just are ready to retest that neckline?
That's possible too – and that would go along with the Rounded Reversal / Arc pattern I was mentioning.
Target would be in the $1,280 / $1,300 area if the neckline distance is roughly $120 and neckline is in the $1,160 area.
At what price failure tells you we are stuck in the rectangle? Thanks.
FYI, I like your work.
In Hindsight, gold has officially broken out!! I like Murphy's PZG pick to do well, and I typically like a basket of riskier gold plays now that GOLD is looking like a solid currency-commodity for the future even if it is intrinsically worthless in some peoples minds haha. GDXJ is the junior miners etf and that may do well if acquisition news heats up.