Gold’s Strange Top Heavy Chart with Negative Divergences
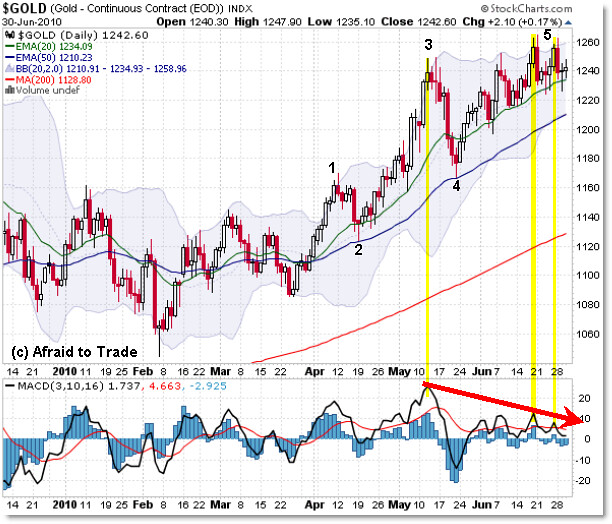
There’s something I’ve been observing on gold’s daily chart which is worth sharing – namely it’s the strange technical (chart) position of the “top-heavy” feel of the price, a terminal short-term Elliott Wave Count, and a lengthy negative divergence at the recent highs. It’s not as complicated as it sounds.
Let’s see them all:

By “Top Heavy,” I mean that the most recent move felt a little forced, or sort of like bulls are pushing price higher, but doing so with increasing effort to keep the price up – almost like the weight of gravity is defying them.
That’s more of a ‘feel’ than anything scientific, but there are objective ways to interpret this.
First, I’ve labeled a short-term “Elliott Wave fractal” 5-wave count on the move from April to present. That’s interesting.
On that short-term 5th wave, we see a crystal clear negative momentum (3/10 Oscillator) divergence that undercuts (fails to confirm) the new push to gold’s recent highs.
The $1,260 per ounce level is serving as resistance while the rising 20 day moving average is serving as support. One of those HAS to break soon – if anything because the average is rising to converge soon with the $1,260 level.
As of this writing, gold is down $20 in the morning session, which isn’t shown in the chart above (StockCharts.com updates end-of-day for gold).
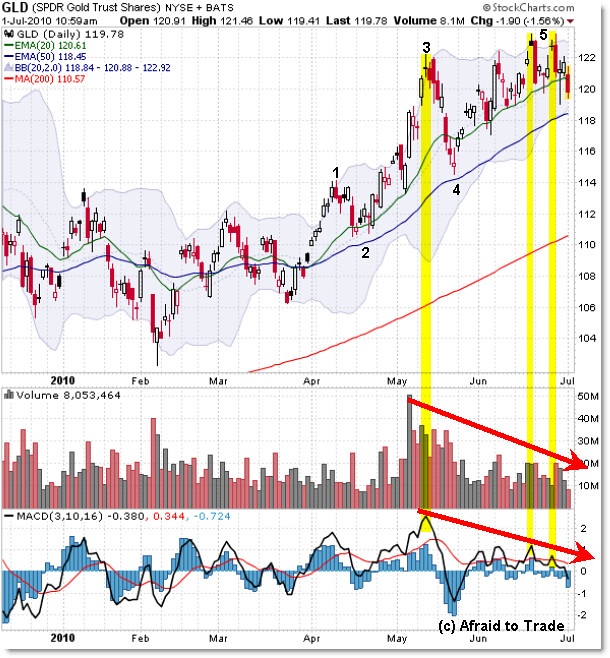
To see that, let’s turn to the popular ETF GLD:

The overhead resistance in GLD is $124 per share, and the rising 20 day EMA rests at $120.
But wait – sellers broke price down through the recent support of the average, which sets up a sell swing to test the rising 50 day EMA at $118.50.
In the event that sellers push gold under the 50 day average – which rests at $1,210 in gold itself – then we could see a further sell-off materialize.
In addition to a negative momentum divergence, we also have a negative volume divergence at the highs – both of which undercut the high and suggest a deeper retracement is brewing.
Strange – I along with many people would have expected gold to bust to new highs as the stock market collapses through support – but we have to listen to the message from the charts.
I’ll update this situation more in this week’s report to members. It’s certainly something to watch.
If we really do go into a stock market crash from here – or a continuation of the crash in process – we could be looking at another October 2008 scenario where EVERYTHING falls as investors panic. Oil is already down $3.00 per barrel so far this morning.
I suspect we’ll know soon enough.
Corey Rosenbloom, CMT
Afraid to Trade.com
Follow Corey on Twitter: http://twitter.com/afraidtotrade

The age of competitive currency devaluations commenced on June 7, 2010, when the US Dollar, $USD, turned down as the Euro, FXE, rallied on news of the call for the EFSF Monetary Authority to be established (it as of yet, still has to be approved by member states) .
The chart of the US Dollar, $USD, traded by UUP, shows today’s massive fall from a head and shoulders pattern, to $84.53.
All currencies, with possibly the exception of the Yen, FXY, have now peaked out; and are in various stages of fluctuation. The Euro, FXE, is currently rallying with the strong European currencies, the Swiss Franc, FXF, and the British Pound Sterling, FXB; never the less, these currencies are only rallying; they will never ever reach their former highs.
The Euro, FXE, jumped higher with the strong European currencies, the Swiss Franc, FXF, and the British Pound Sterling, FXB.
The Swedish Krona, FXS, and the Brazilian Real, BZF, was drawn up as well; all on the Yen, FXY, popping yet higher.
FXE: 2.39%
FXF: 1.75%
FXS: 1.61%
FXB: 1.60% ..
BZF: 1.09% ..
FXY: 0.93% ..
The jump in the Euro, came partly from bullish trading, partly from being drawn higher with the strong European currencies, the Swiss Franc, FXF, and the British Pound Sterling, FXB, and partly from the call for strong economic governance coming from the EU Commission as reported in EurActiv article Brussels Tables New Economic Governance Plans. The European Commission yesterday (30 June) presented its latest proposal to strengthen the Stability and Growth Pact after the Greek crisis had exposed the weaknesses of the EU’s budgetary surveillance system, proposing four policy enhancements.
ETF gainers included: Spain, EWP, 4.7%, Italy, EWI, 2.9%, Austria, EWO, 2.6%, European shares, FEZ, 2.0%.
If the currency traders take the Yen, FXY, lower, the Euro, FXE, will likely continue strongly and world stocks, ACWI, and the S&P would likely rise.
Gold, $GOLD, despite today’s fall, and potential to fall to 1090, has clearly arisen as the sovereign currency and storehouse of wealth; its true worth is in the protection it affords in black swan events such as the possible collapse of British Petroleum, BP as written about by Gordon T Long in ZeroHedge Article Sultans Of Swap: BP Potentially More Devastating than Lehman .