Interesting Patterns on LVS Weekly Chart
A reader asked me to take a look at Las Vegas Sands (LVS) and I found some fascinating patterns, including a complete Elliott Wave Count, Cradle Trade, and Bear Flag. Let’s see these in action!
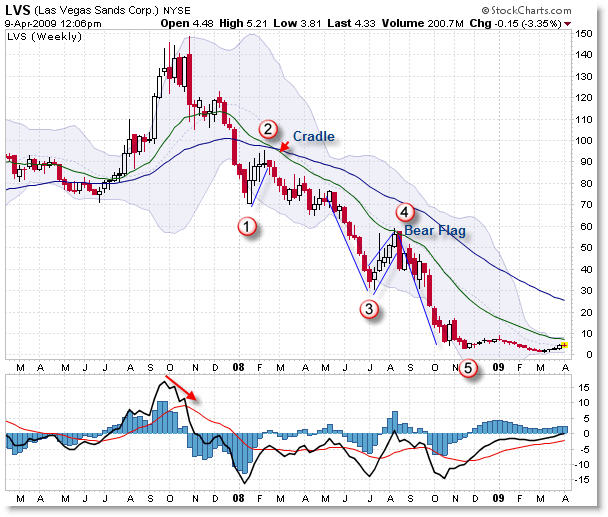
Las Vegas Sands (LVS) Weekly:
Las Vegas Sands is a Gambling/Recreational Company famous for their casinos.
Price made an all-time high of $150 per share in October 2007 (right as the market itself made all-time highs) but this stock cratered almost to zero within a year’s time, serving as a lesson that stocks can fall much further than you think they can and that selling a losing investment early is often a preferable strategy to “holding and hoping.”
Price formed a Five-Wave Elliott Structure into the 2008 lows – notice the clean progression and fractal movement.
Notice also that the “Cradle Trade” formed again on Elliott Wave 2. A Bear Flag formed on Wave 4.
The momentum oscillator was not particularly helpful in giving us specific clues, so it was useful more as a “Swing Confirmation” Oscillator than its normal “Momentum Oscillator” Function (remember, the 3/10 Oscillator is 3 indicators in one – Momentum, Swing, and Trend).
Focus also on the clean Bear Flag that set-up which led to the final price lows at the end of 2008.
There’s many more insights to gather from this chart, but I wanted to highlight a few of these for you. Keep looking for other lessons to learn from this chart!
Corey Rosenbloom
Afraid to Trade.com
Follow Corey on Twitter: http://twitter.com/afraidtotrade
Travel to the LA Trader’s Expo in June to hear Corey speak on “Idealized Trades for Intraday Traders”
Cory !!
A humble request from me. Could you please explain what all you look at the end of the trading day to get an idea about the strength/ weakness of the overall market other than price and volume..
regards
Vasu
I’ll use breadth indicators, partiucarly on the StockCharts.com page (they have a section for it) and then look at FinViz’s big color chart page to see which sectors/stocks did remarkably well for the trading day. http://www.finviz.com is probably the best to see it. StockCharts also has a similar sector overview as well.