May 14 Update Market Sells off Exactly on Cue
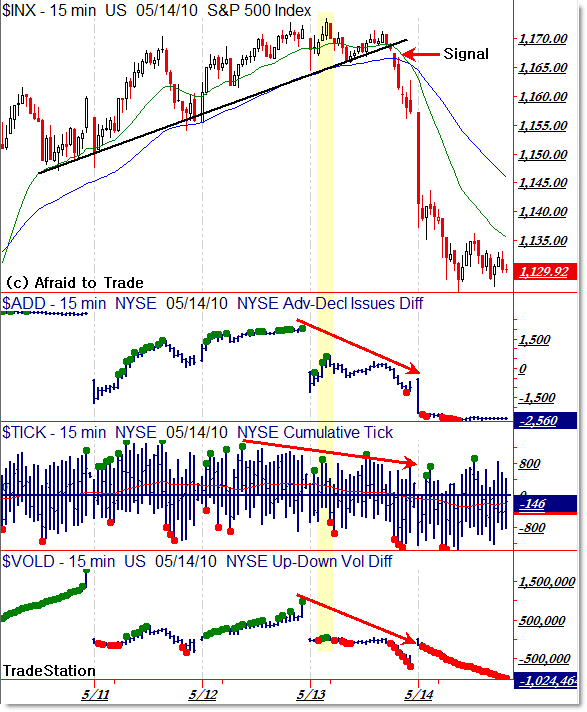
Today’s mid-day update brings us up to speed on the chart/analysis I showed yesterday which stated,
“If the Market is Going to Turn, it will do so Here.”
And that’s exactly what happened.
Let’s see the intraday structure with updated internals and then the ‘damage’ done to the daily chart.

I mentioned that the odds of a downturn were strong due to the obvious negative internal divergences when combined with the ‘test’ of the falling 20 day EMA at 1,172.
That was enough to send bears out of hibernation and cause bulls to take profits… and the ‘positive feedback loop’ sent prices lower as expected.
For swing traders, this was an irresistible trade, as the stop (depending on whatever vehicle you are using) was if the index rose above 1,175.
Take some more time to study this extremely low-risk, high probability short-sale (or take profits) set-up.
Price officially gave us a sell signal just before the close and sell-off yesterday as we broke the rising trendline at 1,166… and shortly after, the positive feedback loop began (bulls selling to take profits or taking stop-losses and bears selling to put on new short-sale positions).
Internals all hit new lows this morning and price is consolidating currently after the morning sell-off. It looks like bulls are trying to defend 1,130 as support. Let’s keep our eye there to see how it plays out.
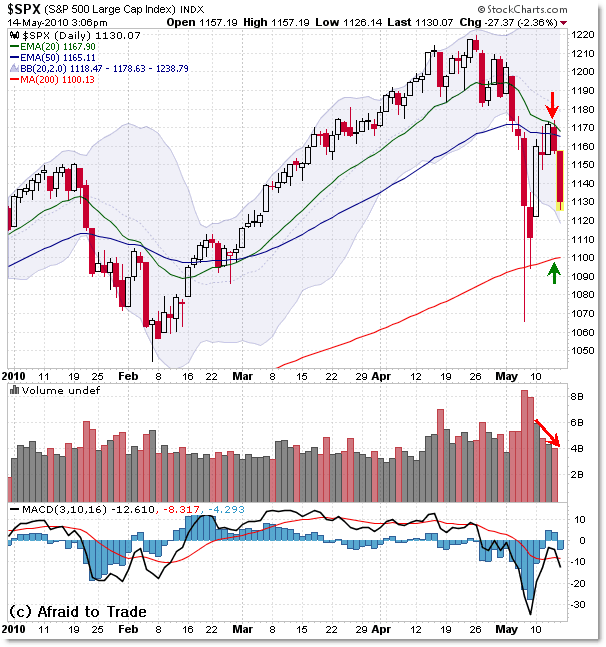
What damage did this do to the daily chart?

We almost formed a nice “Cradle Sell” trade yesterday as price tested the underside of the 20 and 50 EMA. An official “Cradle” triggers when price rallies into the exact crossover (death cross) of the 20 and 50 EMAs… I would say that we “Jumped the Cradle” yesterday. Great set-up anyway.
We expect price to fall after price rallies into confluence EMAs.
That happened in early February with the nice “Cradle Trade” into the 1,100 area… but by mid-February, price broke back above the averages, initiating a vicious short-squeeze.
We’ve already broken under the important price level of 1,150 (the January high) so that places the odds in the bearish camp; bulls were unable to hold that level today as support.
There’s really no ‘obvious’ chart support until we retest the rising 200 day SMA which forms a confluence with the vitally important (psychological) area of 1,100.
If sellers continue this move, that’s exactly where we’re headed… again.
Stay tuned for more updates, and manage risk appropriately in this rapidly moving market.
Corey Rosenbloom, CMT
Afraid to Trade.com
Follow Corey on Twitter: http://twitter.com/afraidtotrade

Gap filled. Mission accomplished? Boy do I wish I bought a vix etn today instead of shorting spy and eem.
Have a great weekend Corey!
Hey Corey,
Spot on analysis. Much appreciated as always.
I'm curious, what do you make of today's awkward grind sideways, and then that little pop into the close? Do you think we'll fill the gap at 1156.50?
And what's your take on the Euro (or the USD versus other currencies in general). Do you think there's still some room for the USD to appreciate?
Cheers
A.