Quick Elliott Wave Update on the SP 500
Let’s take a quick look at the developing potential Elliott Wave Structure of the S&P 500, starting with the Daily Chart and then dropping to the 60-minute timeframe (mid-day update).
S&P 500 Daily Chart:
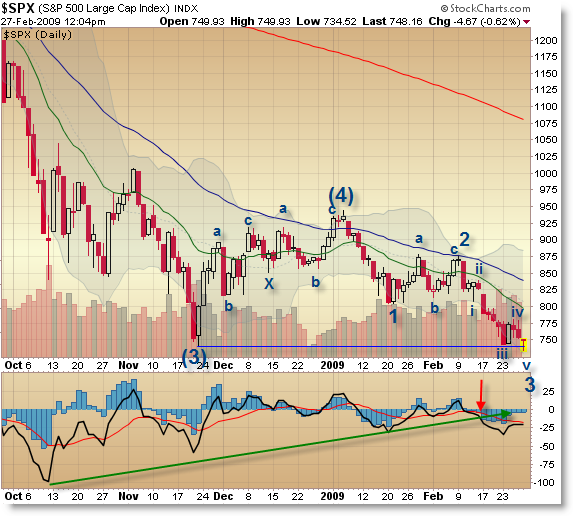
Without going into too much detail, price appears to be in Wave 3 of terminal Wave (5), with perhaps a few more swings to complete the pattern before launching into a larger corrective (up) pattern.
Within Wave (5), price formed fractal Wave 1 at the January Lows then formed an ABC Flat up to EMA resistance (and a doji) at Wave 2.
We are now in – or just completing – fractal Wave 3, which has now officially completed its 5-wave structure as the S&P hit a new low today. Technically, the (5) wave could be complete because price has made a new low and the 5th could truncate here… but it feels like we’re missing the fractal 4 up and then final fractal 5 down.
I laid out this case in my February 17th post “SP500 View with Elliott Wave Projection to Start the Week” where the Wave Structure has played out almost perfectly to how I was interpreting the Wave Structure.
Also, reference back to my prior post in mid-January: “We’re all set to Test or Break the November Lows.” You didn’t need Elliott Wave to tell you that the odds favored a test of the November lows once some key chart points developed.
Let’s break down this 3rd Wave we’re in right now on the 60-minute chart.
S&P 500 60-minute fractal wave Chart:
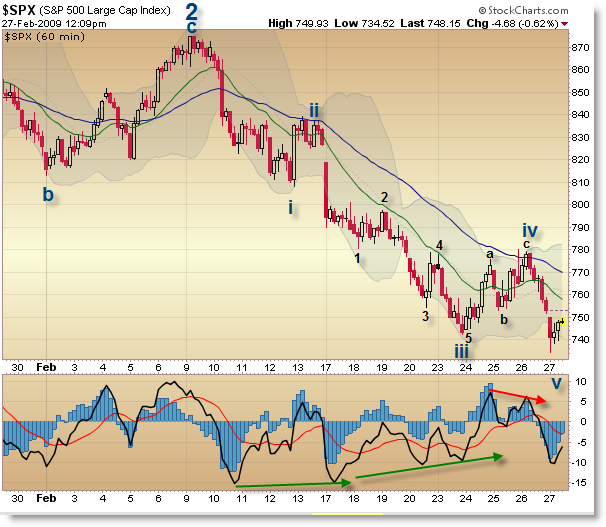
According to this count, it is conceivable that the Fractal 3rd (of (5th)) has ended and that a Fractal 4th ABC might be upon us… but it’s also possible – perhaps structurally more likely – that the v Wave needs a little further to go to complete itself and finish off the fractal 3rd wave (keep in mind impulse waves subdivide into 5 waves and corrective waves subdivide into 3 waves).
Laying aside the Elliott for a moment, we see price making new lows on multiple positive momentum divergences. That’s a good sign for the bulls, but price is still in a long-since confirmed downtrend (since February 11th) and the EMAs are in the most bearish orientation possible and price is beneath them all. Price just found resistance at the falling 50 EMA, confirming the downward trend.
There was an excellent short-sell signal yesterday as price retraced back (in ABC Fashion) to the falling 50 EMA on a negative momentum divergence – great trend re-entry (with low risk stop).
Keep the smaller structure in mind as it always constructs (or builds) the larger structure through the buying/selling waves (supply/demand imbalances).
Corey Rosenbloom
Afraid to Trade.com
Look right to me for Elliot Wave but not at AAPL it is little wrong for both trends at same time.
Not necessarily true.
Apple can follow its own Elliott Cycle (as the psychology and pricing of waves develops) which may or may not be in line with the broader indexes.
It’s certainly better and more comforting when stocks follow the broader count for the Indexes but there is no requirement that they do so.
Perhaps the SP 500 is in a large ABC Flat that started in 2000.
Apple was more of an impulse up during that time.
Ultimately, I may be wrong and Apple should be labeled 123 instead of ABC and that a 4 up is coming before a 5 down comes but we have to do the best we can with the information we have in real time and make the best guess possible and be open to interpretation as new information enters the calculus.
Ultimately – on second thought – we’re seeing a similar confluence of Elliott interpretations in AAPL and SP 500 – or at least in how I’ve labeled it.
Apple’s ABC implies the corrective phase is almost over.
S&P 500’s 12345 sequence (of larger C) implies that the 5th wave down is almost over.
Both counts have perhaps a little more to the downside to go before the wave count launches into a new phase – upward – for both… potentially.
On that first chart, you don’t think the positive divergence led to the fractal wave (4) up and now we’re seeing a new momentum low followed by a momentum confirmation?
Kevin,
Good call! I forgot to use that in my analysis but highlighted it (with red arrow) in my chart annotation. I’m actually showing that momentum broke the rising trendline which could be a big deal.
Your comment is in line with what the chart is showing. Fractal 3 just made a NML which hints that a new price low is yet to come (I didn’t want to give specific targets) after a W4 pullback – perhaps into EMA resistance.
Third Waves frequently make NMLs and then Wave 4 up corrects and W5 often forms a positive divergence (or vice versa). It’s how momentum indicators can help confirm a potential/developing Wave Count.
Good call!
Corey,
As were nearing Wave 5 of MAJOR wave A down what is a good target for MAJOR wave B up. SPX 1000-1150 area before starting the deadly and final MAJOR wave C down below MAJOR A low of this BEAR market?
Thanks
Hmm. I know of Two – now three including yours – valid possibilities once we terminate this Wave 5 Impulse Down… all of which call for a major upwards rally, though I’m not exactly sure how to label it (is it B like you say, is it Cycle Wave IV up (in that 2000-2009 has been ABC of a huge IV) or is it simply Wave 4 up WITHIN a massive Wave 3 Down (like I’ve hinted before in the “Which Wave 4 are we in?”)
Seems the targets would converge around the 1,100 area but I try not to go that far out and play the market one swing at a time and not get too caught up in my forecasts.
Keep in mind that *IF* We are in Wave C of the 2000-2009 ABC Flat, then the C wave will have a 5-wave sub-structure. That seems to be the most logical play for my preferred count.
Corey
I believe Wave 4 of Major Wave A down has already happened and were in Wave 5 down of Major Wave A. Wave 3 of Major Wave A down completed at SPX 752 in Nov. and Wave 4 of Major Wave A down completed (topped) at SPX 941 in Jan.
I believe were close to completing Major Wave A down and Wave 5 is almost in. I’m holding out for SPX 700 or below. I will look to enter long on correction /start of Major Wave B up which if retraces 50% would be near SPX 1050-1100 area then look to sell swing Longs and position short for MAJOR WAVE C down which should be BAD BAD BAD as Major Wave A down. This wave should take SPX near 500-550 then might complete end of this BEAR market.
Thoughts?
Corey,
I know that you do great analysis. But, the founder of Elliot wave Mark Pretcher himself is calling for a rally at this point. What do you think about that?
Anon,
First, Prechter is notoriously early, having called the 1987 crash as the Grand Supercycle Wave V of (5) of 5 of (v) of v etc (a little humor in that statement) and said that an immediate bear market would follow to take the Dow down to 400. Needless to say he was wrong.
Second, Prechter said himself that he might be early in his call, but we are on the same page. I see very limited downside movement – although I do think we need one or two small swings to finish off the whole pattern – but we’re in the late, late, late stages of this 5-wave decline that started in 2007. I suspect we’re all seeing the same thing Prechter is seeing – he’s just getting on TV and saying it. I have a lot of respect for Prechter and feel he’s right in his call and am glad he’s getting publicity for it.
I don’t see where we’re in disagreement, other than I think we have maybe one swing slightly lower and then we go up from there into a corrective ABC.
MW B:
I know an argument that describes this whole move down from 2007 – present as a Wave 1 of C. Of course, I don’t need to say how bearish that count is… and won’t share my thoughts on its validity but I haven’t heard anywhere where it’s an A.
Hmm. I suspect that’s a possibility.
For me and my trading, I keep it as close to home as possible and try not to forecast out years into the future.
The next probable move is to the upside once this 5-wave structure completes from 2007. Is it a B Wave? Is an A of 4? Which 4 is it? Is it a 2 of C? Is it Wave 1 of 5?
I don’t know. But no matter what we call it, odds favor higher prices. Once prices top out, do analysis then. In fact, do analysis all the way up, or change your opinion if it keeps going down.
I play the next likely swing and manage risk around it as best I can and not get caught up in long-term forecasting.
Corey,
The reason I ask is looking to put 401K cash back to work near term. I’ve been in cash since DOW 12500 level and now want to play the bounce. So far this whole Bear I’ve only lost 8% in my 401K. Looking to put that cash to work and then get out again once lower lows come in.
That is why I asked forward looking .. thoughts?
MW B:
You’ve held up much better probably than 90% of investors during this bear market so that is an excellent accomplishment.
I can’t give you any specific advice as I don’t know your situation but as Bob Prechter and many others using Elliott Wave are saying – we’re probably due for some sort of (perhaps big) counter-rally back up, but from exactly which price it will start, there is no consensus. Where it will end? No consensus.
But however you label it, odds do seem to favor some sort of correction up – perhaps even a big ABC – is the most likely swing(s) – but there could still be one or two more down-waves to go, particularly if we’re in 4 of 5… that means we have one more down wave to go before the ABC comes.
If we’re still in fractal 3 at the moment, then we’ll expect a smaller ABC 4 (that won’t go above 800) before a larger 5 comes to finish out the larger 5 wave pattern.
We’re very near the end, but we either have 1 swing or 2 more downswings to go in my humble opinion. Both could be small, but we need them to complete the Elliott ‘form’ or structure.
Corey
I’m 40 with 200K plus in 401K currently. I will not touch 401K money for another 25 years. My job is ok currently however personal income will drop in 2009 but still making more money than bills. I own both my cars and have 61% of my home paid off currently.
Really looking to get positioned for nice gain using this 401K cash. It could really help me later on in life if I can keep even or even get ahead using 401K even in this Bear Market. If this market isn’t higher in 20 years from today’s levels then IMHO There will be no Stock Market period.
Thoughts?
Well that’s a good point. I had a friend who in 2002 or 2003 purchased a gourmet food/gift store and I – being the risk averse person I am – asked him “What if you lose everything?” and his response was similar to yours:
“Corey, if people stop buying chocolate, then something is very, very wrong with the economy.”
It was said sarcastically, but his company is now perhaps inches from bankruptcy as people have stopped buying chocolate and everything gourmet/luxurious as something really is wrong with the economy. Lehman and Bear Stearns no longer exist – who saw that coming in 2005? 2006? 2007? So much has gone so wrong.
25 years from now, I think everyone’s in consensus that the stock market will be higher so the risk is might be worth it.
But just like he said and you said, if the market is not higher 25 years from now than it is today, chances are something seriously, seriously went wrong along the way and I dare not think of what may have resulted in that outcome.
Corey,
If Market isn’t higher then Metals will be only safe place. Silver Coins and Gold along with Oil & Nat. Gas.
You will have to be holding actual items not ETF’s of the stuff.
I was about to say that – about the physical commodities.
We don’t think it could happen and is a very low possibility, but the Dollar could be worthless 10 or so years from now. ETFs might surge in value but the dollars would plunge if the worst scenario happened. The Dow Jones might reach 25,000 or 50,000 or even 100,000 25 years from now but that won’t mean much if the dollar is worthless (due to inflation or whatever other reason), which contributed to the index price inflation (quoted in dollars).
http://www.cnbc.com/id/15840232?video=1047685901&play=1
Corey,
Pursuant to your earlier discussion of two separate counts. Is the 5 down you’re counting the completion down from peak S&P 1576 on Oct 2007? Or are you counting it as fractal 5 of 3 down, that 3 down starting from S&P 1440 in May 2008?
Personally — and I know bulls will hate me for saying this — my intuition pushes me towards the latter count, and the November lows were 3 of 3 down, and now we’re completing 5 of 3 down. Which would mean we are in for a months-long wave 4 up yet and then even a 5 down after that to rather scary lows.
Hard for me to explain exactly why I feel like this is a better count, it’s a lot of disparate factors put together and really has more to do with long-term forecasting than just the shape of the graph. There is a lot of uncertainty out there, nobody knows how much bleeding is left to come in the credit unwind, and as you said yourself, half the mainstream is still calling bottoms over and over again, which feels like wave 3 psychology to me rather than the end of a bear market. If we were done you’d think bulls would be universally ridiculed right now, not constantly competing for airspace.
More: top to bottom in dot-com was ~3 years and we’re only 1.5 years into this slide. By the time we hit the bottom of the markets in dot-com, GDP growth was approaching zero again, not still falling faster every estimate. 3/10 momentum in monthlies is at a 10-year low, and still falling more negative. I could go on.
Anyway, just wondering what you think. I would agree that soon we’re going to hit some kind of bottom that lasts for at least several more months, it just doesn’t feel like THE bottom.
Kevin
Kevin
Good observation – you’ll notice I’m sidestepping this question in the public blog. I’m not convinced either way and am open to both possibilities – I am not comfortable yet to label a public chart one way or the other… preferring instead to focus on this 5th wave’s completing.
What’s important to me from a trading standpoint in my accounts is that either way, you’re looking at a big rally up very soon. My thinking is that when we get there, I’ll have more information and can make a decision at that point as to which count is more likely. It’s almost like cheating to buy time. Either count has us going up so why not try to capture some of that gain? I think it will last until mid-2009 or later which is plenty of time to figure up if that is Wave 1 up (meaning we finished the Bear Market for good) or Wave 4 Up (meaning Wave 5 down is yet to come).
And guess what, both counts will align again When it is Wave 2 Down… or Wave 5 Back down.
The tipping point will be if the Wave AFTER the big up wave makes a new low or not. IF it makes a new low, then we’re in Wave 5. If it finds support and hooks back up, then we just saw Wave 1 of a new bull market and might be in a powerful 3rd Wave up at that time.
But we won’t know for sure until 2010 perhaps.
I’m not paid for an accurate Elliott Forecast… I’m paid if I’m trading profitably. So, as long as the counts are aligned, as a short-term trader, I don’t care which one plays out or which one is correct as long as I am able to make money and not get whipsawed around too much.
Corey, I have the same count. I have a (4) ending at the start of 2009 and we’re now in the terminal Wave v of Wave 3 of (5).
But if this count is correct then the big rally is still some weeks away. Wave 3 should end next week and then we should have Wave 4 up. That should last at least a couple of weeks (Wave 2 up lasted 3 weeks). Then we would have the final Wave 5 taking us to further new lows to complete the pattern and make everyone think the sky is falling and then……. the big rally we’ve all been waiting for! Maybe in April? Oh well, enough crystal ball gazing for now. 😉
As for Prechter being on CNBC, that can only be viewed as a contrarian indicator that the bottom isn’t too far away.
Looks like your posts don’t have dates?