Quick Resistance Trade Planning in Goldman Sachs GS
Goldman Sachs shares currently trade into an inflection point with likely downside potential.
Let’s take a focused perspective on the current range resistance pattern and plan a bullish dominant and bearish alternate trading scenario.
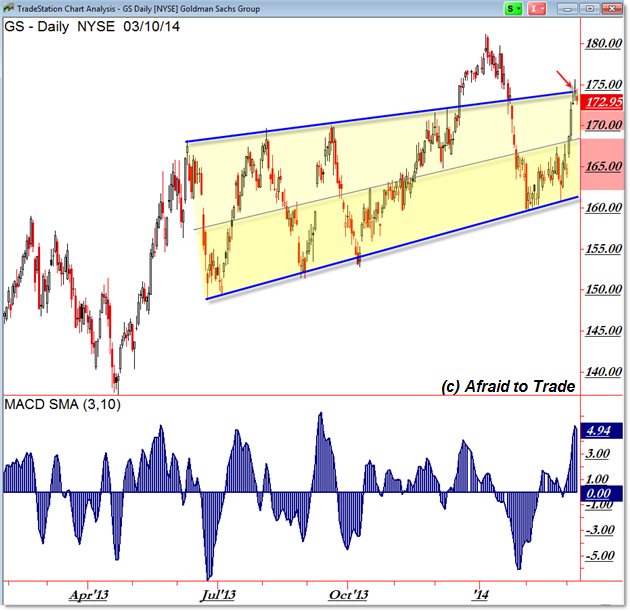
We’ll start with the simplified Daily Chart of GS shares in a rising rectangle:

With the exception of a little Bull Trap in January, Goldman Sachs (GS) shares have traded within the boundaries of a rising rectangle pattern.
If the structure continues to hold, then the next expected swing would likely be to the downside against the upper resistance level near $175 per share.
Essentially, if we oversimplify the picture, we’re at the same “Make or Break” or “Will it or Won’t it” spot from November 2013.
Shares similarly traded up into the resistance level with reversal candles developing into the $173 level where price stagnated for a few sessions then broke impulsively above resistance to trigger a short-squeeze rally into the $180 per share target.
Price then returned to the lower support line as is often the case with a Bull Trap Scenario and Outcome.
Keeping things just as simple, traders will acknowledge the upper resistance line and the classical odds for a reaction (swing) back down away from the $175 level.
We won’t stop there, however – we’ll note the prior event from November where an “Alternate Thesis Bullish Breakout” triggered as shares powerfully rallied towards $180.
Barring any ‘surprise’ upside break here, the Dominant Thesis will continue to call for a short-term retracement.

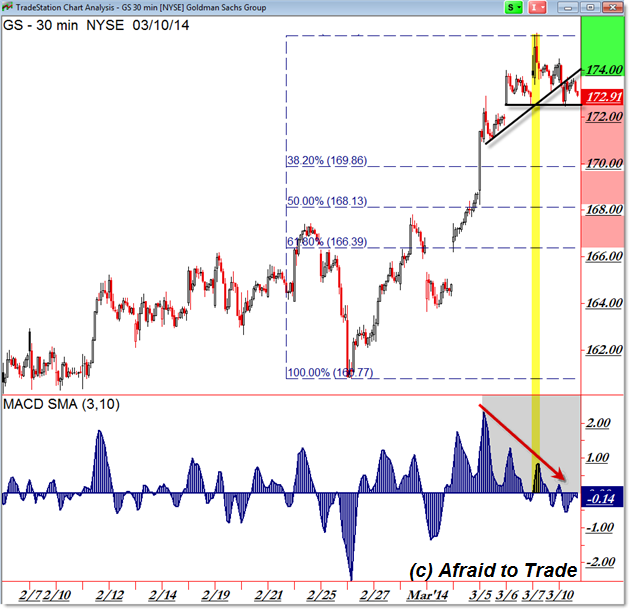
The intraday chart shows a triple-swing negative momentum divergence into the $174 target area along with the break of a mini-trendline at $173 per share.
The breakdown under the small support shelf into $172.50 can be another potential breakdown signal to play for lower targets such as $170, $168, or even the $167 level.
A full reaction down toward the lower “rising” rectangle trendline targets the $161/$162 level.
Continue watching – or trading – shares within these parameters and be prepared to enter bullishly (if you are an aggressive trader) on a “surprise” or alternate thesis breakout opportunity above $175.
Follow along with members of the Daily Commentary and Idealized Trades summaries for real-time updates and additional trade planning.
Corey Rosenbloom, CMT
Afraid to Trade.com
Follow Corey on Twitter: http://twitter.com/afraidtotrade
Corey’s new book The Complete Trading Course (Wiley Finance) is now available along with the newly released Profiting from the Life Cycle of a Stock Trend presentation (also from Wiley).

