Resolution of the 1937 Dow Bear Market
What happened directly after the Dow Jones Index completed its 5-Wave downwards pattern from 1937 – 1938? And might the same thing unfold in today’s market? Let’s take a look.
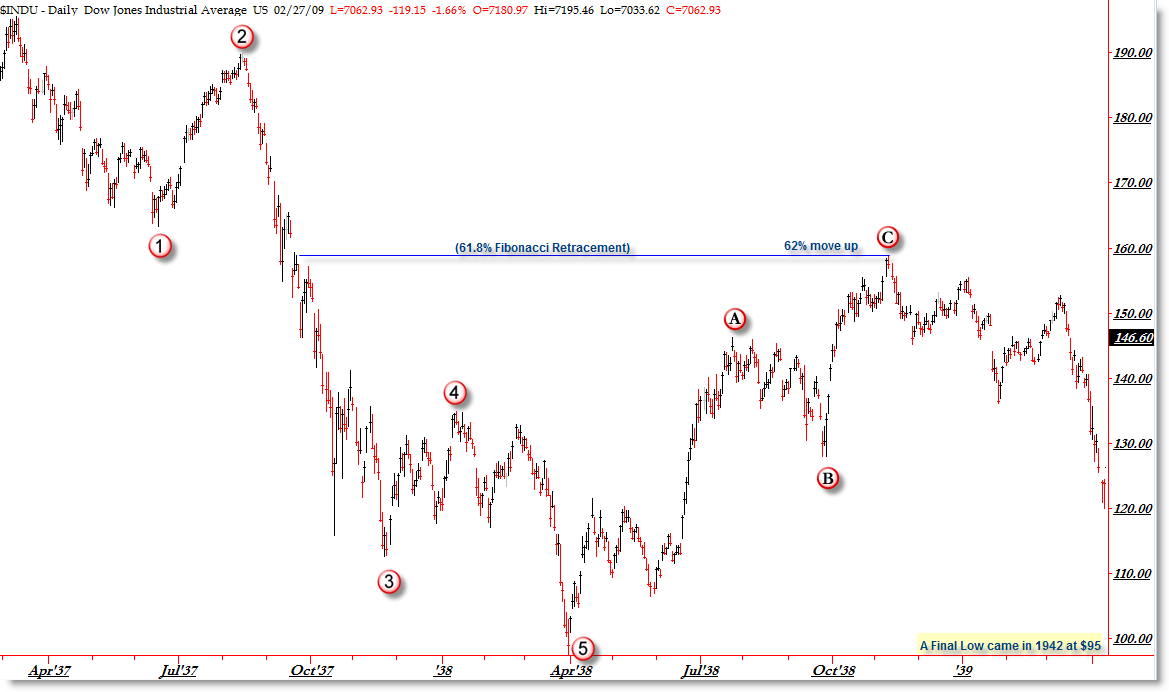
We had an ABC Up retracement that lasted about seven months that resulted in a 62% gain for the Dow Jones. It also took prices up to the 61.8% Fibonacci retracement from the 1937 price high to the 1938 price low.
I’m certainly not saying this will unfold in mirror-image fashion today, but that an “ABC” corrective pattern is expected to follow 5-Wave Impulses so it’s certainly not out of the question or realm of possibilities in today’s market.
As great as a 62% gain is in seven months, was that the absolute price low? Unfortunately no, as price actually peaked where I have drawn the “C” Wave (and blue line) and then began chopping around, never to exceed the 160 peak before breaking eventually to new lows in 1942 before the bottom was firmly in place and a massive rally began without looking back.
Let’s get some broader context and see what happened before and after 1937-1938:
(Click for full image)
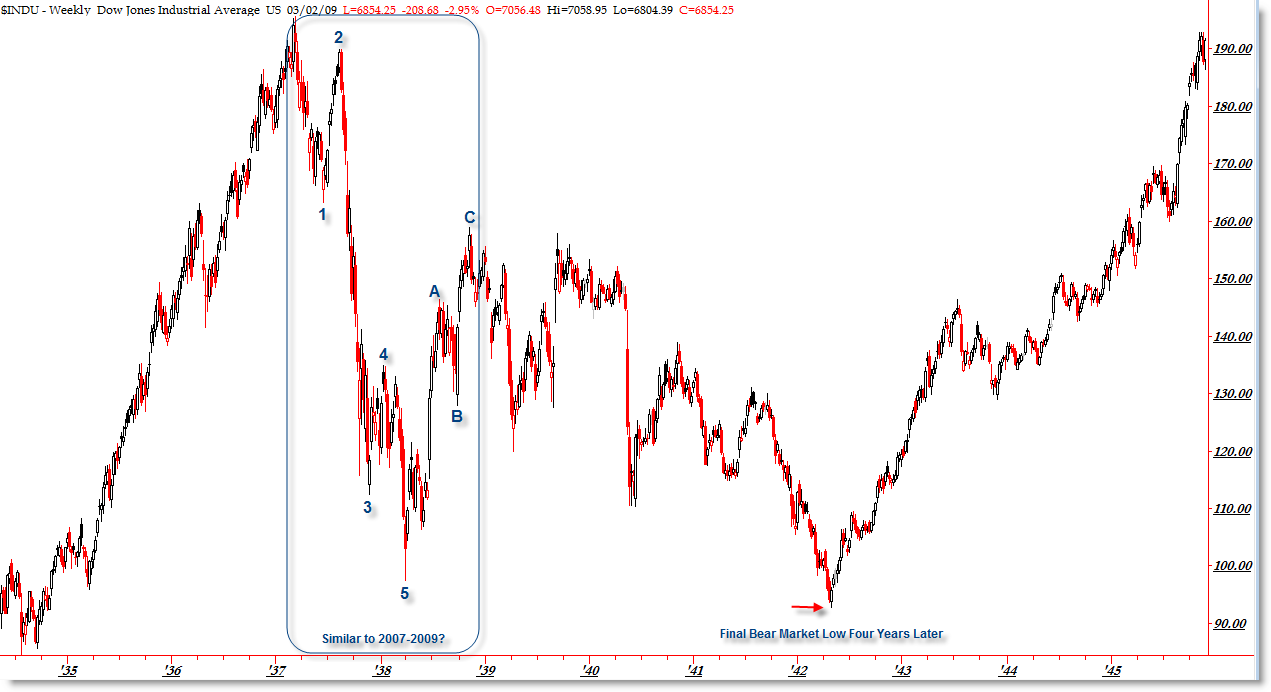
I didn’t take the time to label each wave, because I wanted to show you the larger picture both before and after the specific 5-Wave structure in 1937 that seems to look eerily identical to today’s 5-wave decline off the October 2007 highs.
In this case, the 1938 low was wave (A); 1939 (or late 1938) high was Wave B; and finally the 1942 price low was Wave C.
The question now becomes IF history repeats itself, then the 5-Wave structure we are seeing might be part of a larger bear market… perhaps Wave 1 of the C wave (as in A=2000-2003; B=2003-2007; C=2007-20??).
I’m not ready to make that call yet, but I did want to reference the past for possible clues. The key word is “possible” clues, or guidance from years past in the stock market.
We’ll have a better picture as more price data comes in, but for now, let’s take it day by day and try to manage risk and seek high probability (trading) opportunities as they develop within the unfolding structure as best we can.
Corey Rosenbloom
Afraid to Trade.com
Follow Corey on Twitter: http://twitter.com/afraidtotrade
Register (free) for the Afraid to Trade.com Blog to stay updated
Corey, If you notice, we went down fast. I personally think that is because we have too many trades now, we have the electronic media influencing trading. Just like we went down fast, a recovery should also be fast.
Perhaps, and I hope a recovery up will be upon us soon.
Even with all the changes from 1937 to today, the 5-wave structure played out in eerily similar fashion.
Now, we have instantaneous communication and exponentially more participants than then.
Perhaps odds may favor some sort of trading range or base-building process before heading higher or perhaps it occurs quickly similar to the ABC in 1938 that yielded a60% move.
Cory,
I liked your analysis but have one question – wasn’t the 1937-38 scenario the beginning of the Grand Super Cycle and if so can this move be much smaller or worse far more destructive on the downside?
I can’t speak as an authority on Grand Supercycle waves, but do note the duration and form/structure specific to the 1937/1938 5-wave decline looks remarkably similar to today’s 5-wave decline and there is an expectation that history repeats itself.
As in 1937, the 5-wave decline was not the final low, but was just the first 5-wave decline in a larger structure of a multi-year ABC correction.
It’s likely the 5-wave 2-year structure we are seeing currently will be/already is part of a larger fractal structure, perhaps Wave 1 of the Wave C as Mr. Prechter seems to indicate.
I think it’s more important to focus on the next likely swing (or play) in the market and not get too caught up in the immensely larger structure.
The one thing I keep thinking about is the fact that our current situation overall is similar to the initial crash that started in ’29 (credit bubble burst, etc.)
If you get a chance can you post charts from ’29 to ’35-ish
Only one thing from spain: particulary i think, we are in the same case dow 1.929 and 1.938.
The last wave is a little longer (5), than the first, and we are in the same case of both.
The difference is we are over 50% of discount from the top.
Tks a lot.
Anon,
Thank you for the inspiration.
Tonight’s post (or tomorrow morning) will be on the ’29 crash.
Tony,
Glad to have you from Spain! I would love to visit there one day.
Good point. As bad as 1937 was, the market only fell 50%. We’ve gone beyond that (from the top) which – you’re right – is a bit frightening.
Corey,
Great analysis of the DOW in the 30’s which seem very similar to what we have at the momentfor SP500. Just AMAZING!
Anyway, out of curiosity, what platform do you use for the above chart?
Brandon
Hey Corey,
I love your blogs. Your assumption on the wave count compared to 1930’s vs 2007 C wave right now is exactly the big picture wave count i have been using. you seem to be on the same track as me. Keep an eye out i think we are both headed down right track.
Joe,
Sounds great! Thanks for your comment.
i am looking for a site with information about stock market returns if you miss 10 biggest down days vs missing 10 biggest up days…can you help/
i am looking for a site with information about stock market returns if you miss 10 biggest down days vs missing 10 biggest up days…can you help/