Russell 2000 Makes New Recovery Highs but Must Break Weekly Resistance
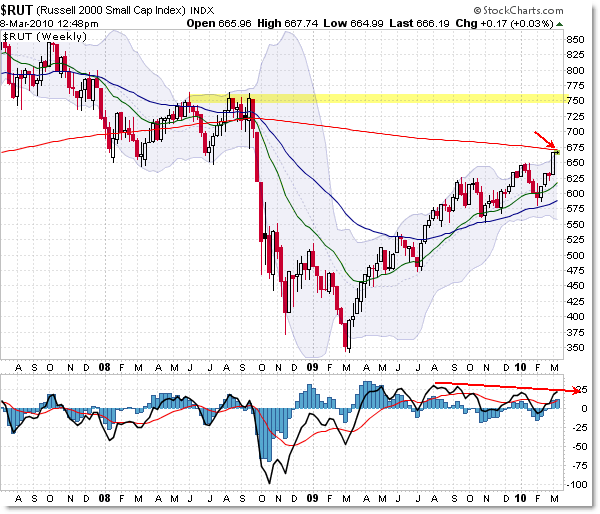
In an interesting turn of events, the Russell 2000 “Small Cap” Index broke to new recovery highs last week in a sign of bullish strength, but now faces headwinds from the weekly 200 period moving average.
Let’s take a quick look at both the daily and weekly Russell 2000 chart to see what level we should watch for important clues as to the strength – or pause – in the recent strong rally.
Russell 2000 Daily:

In the daily chart, we see one of the most powerful sustained rallies on the Russell 2000, which gave us 16 “up” days and 3 “down” days since the early February low of 580. The first rally witnessed roughly nine consecutive days of gains.
The current structure places us at new recovery highs above the 650 highs in January 2010, with a new momentum (oscillator) high confirming the recent bullish strength.
With that picture in mind, we would expect the Russell to continue its power climb higher, and it very well could, but it is going to have to content with a confluence resistance area that might give bulls pause.
Let’s take a look at the ‘triple’ confluence resistance area on the Weekly Chart.

The most obvious form of overhead resistance comes from the 200 week SMA (red) at the 675 level. It would be absolutely key for the bulls to drive price back above the lengthy 200 week (roughly 4 year) simple moving average, as this level is an important psychological ‘mile marker’ on the charts.
Until then, it is possible for the average to hold as resistance.
There is a prior price line of support – which becomes resistance in the future – from the 650/675 level as seen in the triple price lows of early 2008. According to the “Polarity Principle,” this prior support area could become a future resistance level… which is where we are currently.
And although I’m not showing it on this chart, the 61.8% Fibonacci Retracement of the 2007 high to the 2009 low rests at the 660 Index level, which is roughly where price resides currently.
To sum up the resistance areas…
675: Weekly 200 SMA
650/675: Prior Price Support in 2008
660: 61.8% Fibonacci Retracement
A break above 680/685 would likely be enough for a confirmed break depending on your threshold of “break,” which would suggest that odds favored a move back to the 750 level as marked on the chart above.
Let’s see what happens at these all-important boundary levels.
Corey Rosenbloom, CMT
Afraid to Trade.com
Follow Corey on Twitter: http://twitter.com/afraidtotrade

2 Comments
Comments are closed.