SP 500 Midweek Daily Chart Structure Apr 22
Let’s take a quick mid-week look at the S&P 500 daily chart structure for April 22, 2009.
While I’ve been making much of the “Bearish Rising Wedge” (which was broken to the downside on Monday), keep in mind that it still looks like we could be forming a “Rounded Reversal” on the Daily chart as well.
Without getting too deep in the weeds, we have a persistent negative momentum divergence in the 3/10 oscillator and a slight (if not flat) negative divergence in volume (as price has continued its trek higher, volume has inched lower most days).
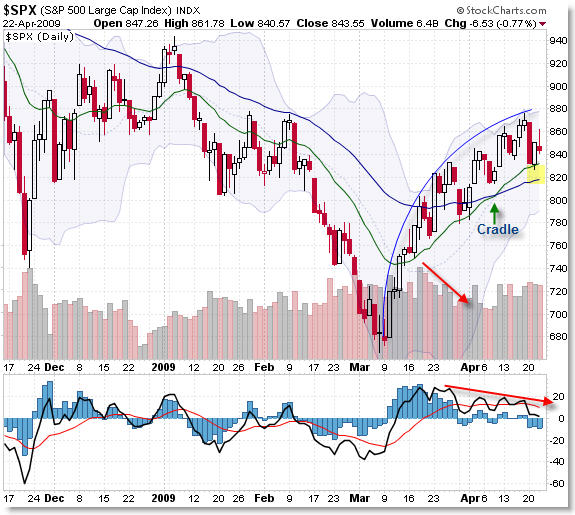
Price came into resistance at the 875 level which proved to be resistance at the February highs. The price “arc” continues as price is nearing (or has reached) the apex (highest point) of the arc.
Now for a bullish look. Price is above its 20 and 50 Day EMAs, and they have crossed bullishly as price ‘held’ the Cradle Trade crossover in early April. I’ve highlighed the ‘space between’ the EMAs which could be expected to hold as support on a subsequent push down.
However, if bears manage to push price beneath 820, then we’ll break known support and enter ‘open air’ to the downside which could pull price back down to the 750 level or below. Needless to say, watch 820 like a hawk. It is the line in the sand as far as I see.
The most recent candle patterns have a hint of bearishness to them, as one can argue that a bearish “Evening Star” (three candle pattern) formed at the April highs or at a minimum, a “spinning top/doji” formed after the price rejection at 875. Today, a ‘shooting star’ or ‘doji-like’ candle formed close to the price highs of the swing. Bulls will have to overcome these candles to press higher.
Keep studying the daily structure for additional clues and manage risk accordingly.
Corey Rosenbloom, CMT
Afraid to Trade.com
Follow Corey on Twitter: http://twitter.com/afraidtotrade
Travel to the LA Trader’s Expo in June to hear Corey speak on “Idealized Trades for Intraday Traders”
if we gonna fall we wouldn fall so slowly as rounded reversal says. do think we can see something like this and this.
Meques,
Very nice drawings. Yes, it’s possible, particularly if momentum picks up on the downside which is often the case.
There also appears to be what looks like a head and shoulders on the first chart there.
I encourage all readers to take a look at these chart examples here.
Interestingly it looks like the bottom trendline on the ascending wedge that was “support” became “resistance” yesterday.
Precisely!
The infamous “Polarity Principle.”