What Pattern Exactly is the SP500 Forming?
So, what pattern is the S&P 500 forming right now? There’s three main possibilities using classic technical analysis at the moment – let’s take a quick look at these three possible patterns and what they might mean.
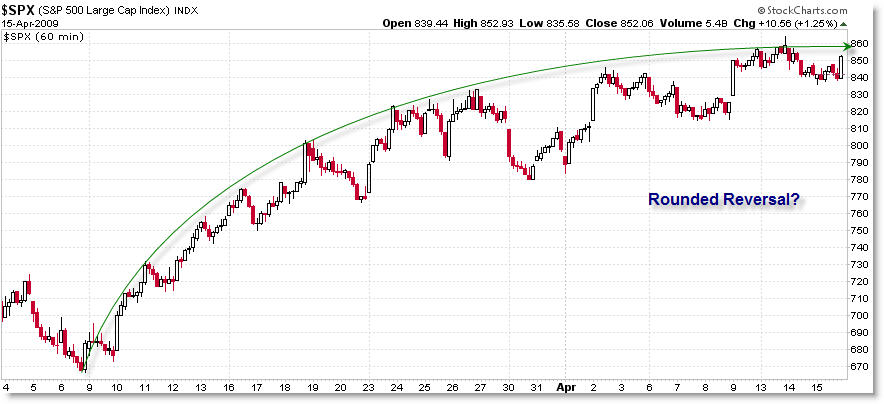
First, it could be a standard “Rounded Reversal”:
(Click on any of these charts for a full-size image)
I think this pattern would be the most fun to watch resolve, in that Rounded Reversals reflect orderly transfer in Supply and Demand (Sellers and Buyers), which implies that we’ll see a mirror image decline as we saw of the rally – if only it were that simple.
The Rounded Reversal pattern takes into consideration the most data points beginning from the early March lows, and I deem it to be the dominant pattern at the moment until proven otherwise. We could still see a slight push up to new highs but if this is the correct pattern, I would not expect us to go beyond 870 to put in a short-term top.
Many people believe we’re forming a Bearish Rising Wedge (or also an Elliott Wave Ending Diagonal):
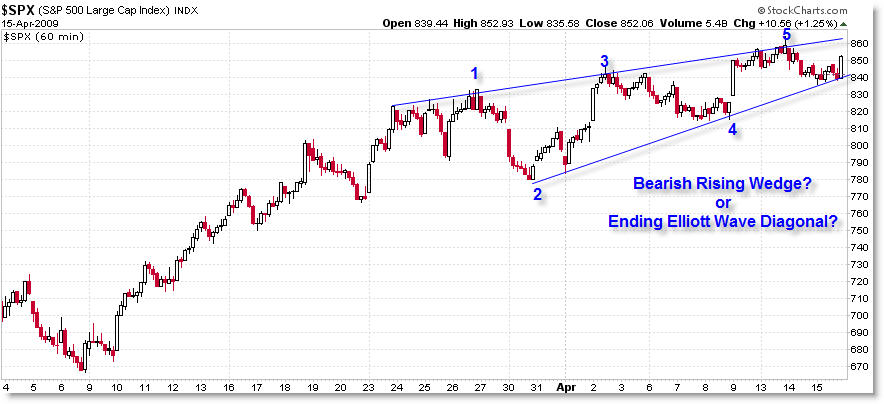
This is the pattern I discussed earlier in the week. Luckily, I was correct in forecasting and trading a downswing to the bottom of the rising trend channel, and we found key support at that line as expected. If this is the dominant pattern, it has a little more ‘room to run’ inside the pattern, as we would expect price to remain contained within these converging trendlines.
The expectation is for a sharp bearish break (eventually), though the pattern would be invalidated by a clean break-out above the 870 level.
Elliott Wave purists are discounting this pattern as an Elliott Pattern because the labeled 3rd wave is larger than the 1st wave and wave 5 counts out as a 5-wave advance – neither of which ‘fit the bill’ for an ending diagonal in Elliott guidelines. It may just be a plain vanilla wedge instead of an orderly ending diagonal (in Elliott terms).
UPDATE: See my new post where I share the difference between Ending Diagonal and Leading Diagonal.
Or maybe it’s as simple as a Rising Trend Channel:

This would be the easiest pattern – other than the Rounded Reversal – for most people to see and perhaps react. Trendlines should touch (connect) as many points as possible, and this means sometimes that you’ll have to account for false-breaks (as which occurred in late March) to pick up more ‘touches.’
The more times a line is touched, the more valid it is, but of course no trendline holds forever.
While the Rising Wedge has a bearish expectation, the Parallel Trendline pattern has a neutral expectation – all we would expect would be a break-out of the ‘rising rectangle’ which should lead to a price expansion move once a clean break is signaled – it could occur in either direction according to basic technical analysis.
Conclusion:
Take a closer look for yourself as to which pattern you feel is most likely. It may not even be a pattern I have listed here – you may be thinking something totally different.
Hopefully, it won’t be much longer before we all find out and trade accordingly!
Feel free to share your thoughts on the dominant structure or price pattern you see developing.
Corey Rosenbloom
Afraid to Trade.com
Follow Corey on Twitter: http://twitter.com/afraidtotrade
Travel to the LA Trader’s Expo in June to hear Corey speak on “Idealized Trades for Intraday Traders”
Rounded reversal. All in on SKF @ 50, hope for 100, pray for 200, retire from trading for the remainder of the year especially if SKF hits $0 : )
HAHAHAHA
I wish it were that easy. That’s what makes trading fun!
Believe me – if I had the exact answer as to what was about to happen (and not just odds and probabilities based on structure) – I wouldn’t have blogged it and instead would have done just that – leveraged up on the next move and then gone to the Bahamas.
hi corey, i’ve been thinking lately about the possible patterns the s&p could be forming, and this is a good examination of the possible scenarios. i’ve been following your blog for a few months, and i just wanted to drop by and say thanks for the quality of your analysis and comments on the markets
Ascending wedge.
Take a look using a log chart.
Also, Monday we closed at channel resistance dating to Nov 4. I am betting that this channel will hold since it’s defined by the lows of Nov. & March and the highs of Nov & Jan. Must use a log chart to see this channel. If the top of the channel holds, then we will end this wedge soon, IMHO. Thanks Corey for a great service! I love your site and visit every day.
feeling scenario of… rounded reversal
Hi Corey – I’m going to go with a 5-3-5 Zigzag. The second half is an ending diagonal. My thought (and we’ll see if I’m right on this) is that we’re in a large falling wedge/ending diagonal now, and these structures (like the rising wedge) unfold as a series of threes. If we turn in the next few days and make a new low (below 667), this is what happened.
it’s called a “leading” diagonal
Looking at a 3/10 Oscillator, I see this upward momentum weakening – However, a few months ago had the same weakening in the upward trend and then suddenly to a new high on both 3/10 and price (sorry don’t know date off the top of my head). If BAC and C put up believable profits tomorrow and Fri I can see this happening again – thoughts?
Unfortunately, a problem with trend analysis is that works much better in hindsight than foresight. However, at the same time since there are many technical traders, common belief in certain patterns may create a self-fulfilling prophecy. I think the only thing one can conclude for certain is that one of several patterns will end up the winner, and thanks for pointing these out. I am discovering also that with trading, all you can do is develop your own responses to various scenarios. If you try to predict what you think the market will do and not have the flexibility to let go when wrong, you will get killed.
Hi Corey, how does the Elliot wave diagonal resolve in our case? I don’t know EW enough, sorry for my ignorance. thx
Hi Corey,
As you must be aware already, there are confluence zones at 8064 and 8353. So logically, the 8064 level becomes the point where we should short it, and a few points above 8353, we should place a stop loss. Correct me if I am wrong. Thanks!
corey,
like your alternatives. good blog.
Leading diagonals are normally seen in waves 1 or A and are the first wave of a larger pattern. The subdivisions of a leading diagonal are 5-3-5-3-5. Ending diagonals are normally seen in waves 5 or C and are the last wave of a larger pattern. The ending diagonal pattern subdivides as 3-3-3-3-3. If this is a zig-zag rally consisting of A-B-(ending diagonal)C then the labels are probably off by one wave since the 1 is most likely part of wave B and the diagonal still needs one more push up for wave 5.
Deez,
It’s certainly open to interpretation!
Thank you for reading and for your comment.
Jim,
That’s one thing I tend to miss – log-scale chart patterns. Good call.
It’s just so hard to bet against the bulls at the moment it seems – they’re relentless!
Anon,
That’s my guess too at the moment but there could be something else going on.
Anon,
You’re right on – we see a volume divergence, a 3/10 Momentum Osc. divergence, overhead resistance, etc but the bulls refuse to cede ground. Friday could be a powerful day either way and – if earnings surprise one way or the other big – then we could see a breakout up or down from the wedge.
I have no possible way of predicting earnings, but wouldn’t that be nice?!
Steve,
Could be right – it’s been difficult to count the waves in this move up so far – it was counting so easy until we broke the 805 highs. Breaking there triggered a few of my alternate counts.
The pattern will certainly be clear in hindsight but we have to do the best with the data we have now.
Momo,
You hit my philosophy exactly – patterns are not magic. They ‘work’ many times because people see them and react to them, placing stops at predictable locations and entering trades at predictable locations. We don’t know exactly what’s going to happen, but the pattern, along with expectations of investor/trader behavior, help us quantify risk and establish larger targets than our stops, which builds our edge.
Nothing magical – just odds & probabilities.
Anon,
It depends if one quantifies this as a Leading or Ending diagonal. Check out Andrew’s comment on here for a background on the pattern.
Diagonals generally are expected to have a similar expectation to a rising wedge – it’s bearish and we would expect a break-down once the lower trendline was violated.
Pankaj,
Exactly, though the market has already broken certain levels of short-term Fibonacci confluence at 805. I would look to the February highs at 875 to be simple resistance which, if broken, could lead to a quick push to the January highs at 940.
I’ve decided the bulls have forgotten the meaning of the word ‘resistance.’
Sumo,
Thanks for reading!
Andrew,
Thank you for sharing – I’ll try to draw in these possibilities or provide some text from Prechter’s book in an upcoming post.
I always appreciate your feedback!
Corey ….Very informative and intresting post. frankly, last few days have been quite challenging from the TA point of view, but then thats what make TA so intresting.
Cheers
Neil,
Precisely! If it were so easy, everyone would be doing it!
im finding s+p a bit hard to read…..whereas the dax is a lot easier to understand and when looked at in comparison to s+p it does make the move a little bit easier to read…………i ALWAYS compare indexes to each other to get a better understanding of the situation…..you may not be able to see that the s+p is about to turn wheras it can look very obvious on another index