SP500 Awaiting Breakout from Fibonacci and EMA Compression
Despite all the major headline news events over the last week, the SP500 has remained relatively contained within well-defined price and pattern levels.
Let’s update our key trading levels and plan potential breakout trading plans.

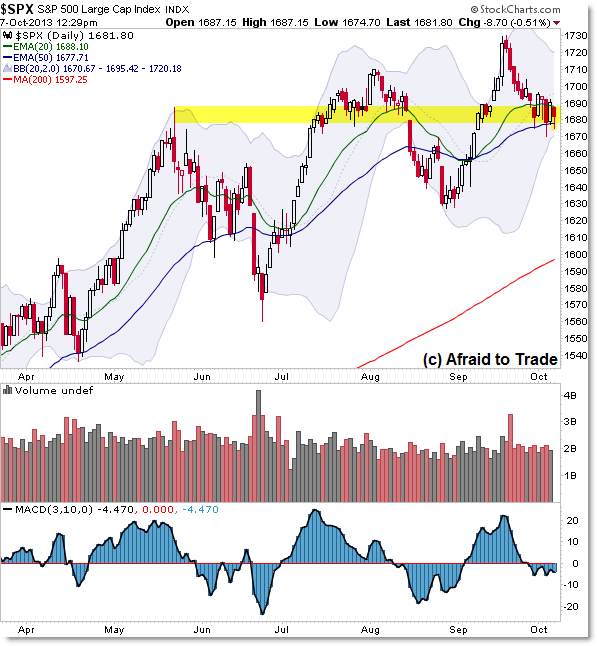
In simplest terms, create short-term trading strategies from the highlighted rectangle consolidation pattern currently in motion.
To be more specific, note the price compression or “ping-pong” between the 20 and 50 day Exponential Moving Averages.
The slightly falling 20 day EMA intersects 1,688 (1,690 is an easy reference level) while the rising 50 day EMA aligns at 1,677 (either 1,675 or 1,680 for easy reference).
This gives us a 10 index point range that actually stretches back to May’s spike intraday high.
For @ES Futures Traders, we can be slightly more specific using a short-term Fibonacci Retracement Grid:

From the late August low to the mid-September high, we note the 50% ‘halfway’ point into 1,671 (1,670) and the 38.2% Fibonacci Retracement into 1,683.
While the trading action in early September within this range was clean, the recent activity has been violent, volatile, and filled with large gaps (including today’s session).
Note that despite the large downside pre-market and opening gap, price (buyers) supported into the 1,670 Fibonacci and price pivot level (along with the 50 day EMA above).
I also drew a small symmetrical triangle developing throughout October – the levels currently align with the rectangle and Fibonacci levels.
Continue watching price movement – the ‘ping pong’ – relative to the Daily EMAs, intraday Fibonacci, and ongoing sideways rectangle pattern.
Price will break free of this pattern and either trade quickly down to 1,660 then perhaps 1,625 for a bearish breakdown or else back toward 1,700 then likely to new all-time highs in a bullish breakout.
Don’t try to predict – trade what happens with deference to any real-time ‘traps’ that occur.
Join fellow members to receive daily commentary and detailed analysis each evening by joining our membership services for daily or weekly commentary, education (free education section), and timely analysis.
Corey Rosenbloom, CMT
Afraid to Trade.com
Follow Corey on Twitter: http://twitter.com/afraidtotrade
Corey’s new book The Complete Trading Course (Wiley Finance) is now available along with the newly released Profiting from the Life Cycle of a Stock Trend presentation (also from Wiley).

One Comment
Comments are closed.