SP500 Playing from one Range Value Area to the Next Reference Level
Sometimes, it’s very important to strip your chart of all indicators and just focus on the message from price, which comes through clearest without all the clutter.
There’s a very clear message from price itself in terms of range/value reference areas, so let’s listen to what price says and how we should treat these key levels.
First, the bigger picture Range Value Areas:

First, let’s define “Range Value Areas.” According to one of the core principles of price behavior (and thus trading strategies), price alternates between periods of Range Expansion (trend/impulse moves) and Range Contraction (sideways/rectangle consolidation moves).
A Range therefore has three specific components on the chart:
Midpoint or Value Line: The “Equilibrium” Point where buyers/sellers perceive “Fair Value” as a reference
Upper Resistance “Expensive” Line: The reference point where buyers/sellers perceive price to be “expensive” or “higher than value” and thus play bearish strategies
Lower Support “Cheap” Line: The reference point where buyers/sellers perceive price to be “cheap” or “lower than fair value” and thus play bullish strategies
This is akin to Market Profile or Auction Dynamics/Profile logic.
These levels – once established – can become self-fulfilling prophecies as more traders react to these levels.
The levels are not hard walls, as price tends to auction beyond a boundary to see if the Dynamics (of supply and demand) change, and if not, the price tends to trade back towards the Fair Value price.
However, once buyers/sellers push price clearly beyond an outer reference level, then the dynamics change and price tends to trend or “expand” as buyers and sellers rush to find a new equilibrium/value price and thus a NEW Range Value Area – with updated parameters – develops.
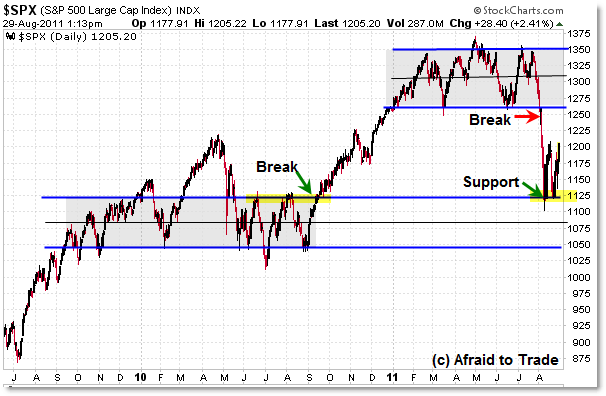
That’s what happened on the breakout expansion from October 2010 forward until the new Range Value Area formed between 1,260 and 1,350.
I posted previously on the importance of this Reference Area until it was broken recently in August:
July 27: Making Sense of the Current SP500 Market Range
July 24: Cross-Market Compression (Range) Reference Areas to Watch
July 16: Monday Morning Market Check at SP500 Midpoint Value Area
July 11: Use this Chart to Make Sense of the SP500 Value Area (Reference)
The general strategy is to trade WITHIN the range boundaries/parameters until the levels break, at which point it becomes best to play range expansion/trending strategies until a new range dynamic develops.
That’s precisely what happened in August, and price is in the process of establishing a new reference area accordingly:

On the firm breakdown under 1,260, price expanded (collapsed as some would say) all the way to the 1,100 level which was just above the 1,120 prior reference area (upper resistance) from the 2010 period.
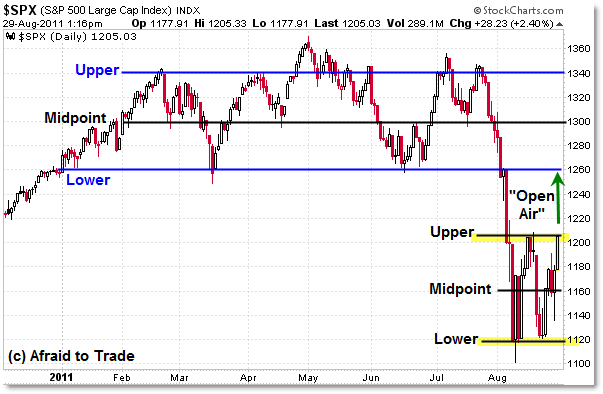
During the last few weeks, buyers and sellers have established a New Value Area at 1,160 with Upper Resistance currently near 1,205 and Lower Support clearly at 1,120.
Given that we’re currently at the Upper Resistance line, the trading strategy is based on how buyers and sellers interact/compete here:
A clean breakout beyond 1,210 on stronger intraday volume and momentum opens up the likelihood that the next move will be a sharp expansion/breakout upward to 1,260’s level as price moves through “Open Air” to a prior reference level.
Alternately, the “Range” Strategy becomes to watch for intraday weakness/sell signals into 1,205/1,210 and if we start to see a quick move down develop, then look to play a return to value at 1,160 at a minimum or even as low as the 1,120 “Lower Support” line.
From these, you can develop logical “IF/THEN” strategies into your game-plan, depending on whether you are a swing or intraday trader.
Study this type of Range Dynamic Logic and use the current and prior reference levels as a guide for your trading strategies.
Corey Rosenbloom, CMT
Afraid to Trade.com
Follow Corey on Twitter: http://twitter.com/afraidtotrade
Corey’s new book The Complete Trading Course (Wiley Finance) is now available!

5 Comments
Comments are closed.