Updating the Key Reference Levels on the SP500 September 2
Well that was interesting – absolutely no jobs were created in August, so says the Non-Farm Payrolls report released September 2nd.
Understandably – both from a news and chart perspective – the market fell sharply Friday morning.
However, what does this mean in the bigger chart picture, and what are the critical support and resistance levels we all are watching?
Let’s start with the weekly frame and move lower:

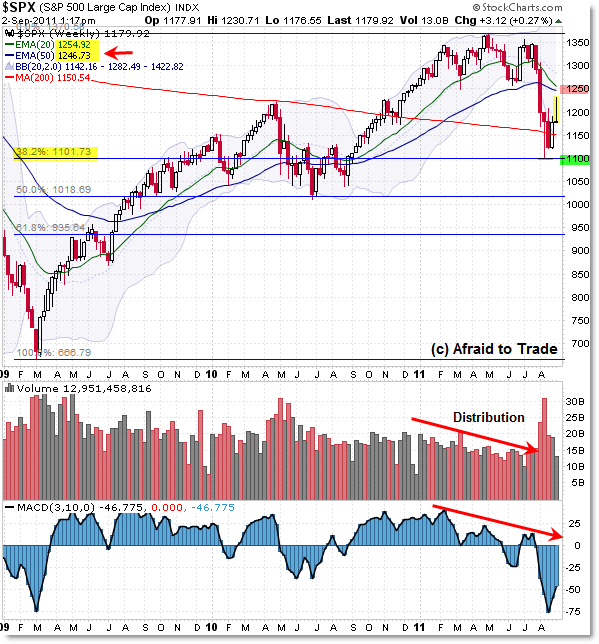
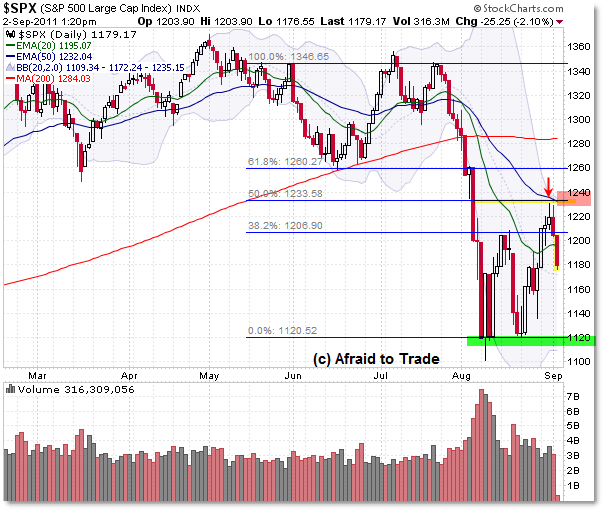
Cutting right to the point, the upper confluence resistance area on the weekly chart is the 1,250 area which corresponds with the 1,240 dual resistance on the Daily Chart.
Underneath, we have the 1,101 level which is both the 2011 spike low and large-scale 38.2% Fibonacci Retracement. The Daily Chart shows that 1,120 is a more important price reference at the moment.
Other weekly chart comments:
Volume steadily declined through most of 2011 as price formed a sideways range that took on a distribution top formation which was confirmed on the breakdown under 1,250. Momentum also formed negative divergences along with volume.
The key to watch is the 20/50 weekly EMAs which are on a path to cross bearishly.
Despite the sharp downside move and heightened volatility in mid-2010, the 20/50 week EMAs did not cross bearishly during this time. This will be one of those “hold your breath” things to see if it develops.
Simple support logic would suggest that a breakdown under 1,100 should lead to an expansion/breakdown move to the next level of confluence support near 1,040 then 1,020.
The Daily Chart gives a closer view for shorter-term traders:

I’ve been sharing this week to my Idealized Reports members that odds were overwhelming for a downward move into the confluence resistance at 1,240 which also showed negative intraday divergences with momentum and volume.
The downward move appears to be falling in place as scheduled on the recent rally into the confluence 50d EMA and 50% Fibonacci resistance at 1,235/1,240.
The subsequent breakdown under 1,200 suggests that the next stopping point for the market will be the 1,160 level then on to the 1,120 confluence.
This is based on the “Range Value Area” logic I posted about earlier in my post “The S&P 500 is Playing from One Range Value Area to the Next.”
Range Value Logic suggests that the current “Midpoint Value Area” resides at 1,160 with lower band support at 1,120 (and upper band support just above 1,200, which we overshot this week).
Markets tend to seek equilibrium between buyers and sellers (bulls and bears), and after overshooting ‘value’ above 1,200, the next logical play would be a downward correction to 1,160 then 1,120.
We’ll monitor the market in the week ahead to see if this thesis continues to play out – for reference, the ‘range’ thesis would be disconfirmed on a firm breakout above 1,240 which would strongly shift the balance to the buyers (as sellers would stop-out/short-squeeze above 1,240).
Corey Rosenbloom, CMT
Afraid to Trade.com
Follow Corey on Twitter: http://twitter.com/afraidtotrade
Corey’s new book The Complete Trading Course (Wiley Finance) is now available!

nice article keep it up!