Stepping Inside Tuesday’s Powerful Trend Day
We finally got that ‘oversold bounce’ we’d been anticipating – though that was an understatement! Let’s step inside Tuesday’s “Trend Day” action to see how one could have profited from the intraday structure and managed risk accordingly.
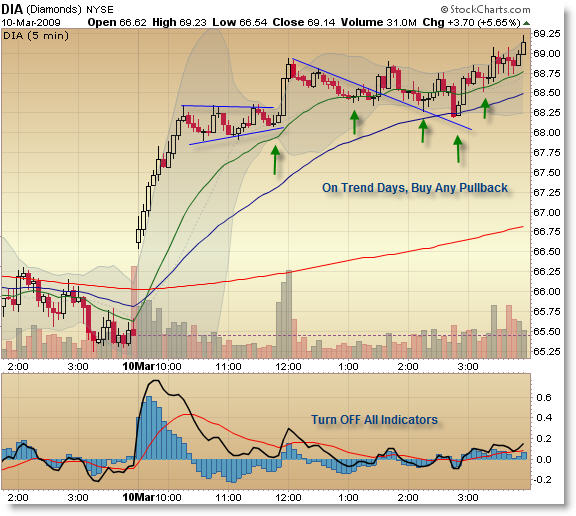
DIA 5-min (March 10, 2009):
First, the daily structure (in terms of two dojis in oversold conditions at the bottom Bollinger Band) seemed to indicate we were due for a bounce. Of course, that structure didn’t say how powerful today’s action would be, but that odds favored an up-move over a down-move.
The first clue comes from the pre-market action (where futures were markedly higher) which was confirmed by a large upside gap (greater than $1.00 in the DIA). As the market opened, price ran still higher and no attempt whatsoever was made (by sellers) to fill the gap – by this time (around 10:00am) you should have been playing for a Trend Day (because of the large gap and drive off the open).
This meant you should have turned off your indicators and focused on your moving averages (whatever periods you use – I use 20 and 50 EMA intraday) to set-up trade entries (on pullbacks).
Strangely enough, Trend Days are the easiest days to trade (buy pullbacks, trail your stop beneath either the 20 or 50 EMA) though so many people have difficulty because they just can’t fathom the price going higher – they’re just always in counter-trend mode. Granted most days aren’t trend days, but when they are, all other tactics (fading intraday highs; selling overbought oscillators) go out the window.
That being said, price consolidated into a rectangle (correction) into the 20 EMA and the Bollinger Bands “squeezed” price which preceded a huge surge up (further confirming the Trend Day structure) and then price formed a gentle ‘flag’ back to the 20 EMA. I love to see dojis form at expected moving average support – they allow for you to use a tight stop and play for a large target (relative to your stop).
I drew an interesting trendline, which indicates how price resisted the level (around noon) but once it broke-out to the upside, it used the trendline as support. Ultimately, price retraced to the rising 50 period EMA (not an unexpected development) which threatened stops (trailed beneath the 50) and gave aggressive traders fresh, low-risk entries (buys).
And as wished, the market headed higher and formed additional dojis at the 20 EMA before spiking back up and closing at its highs.
If you want an ideal or “Picture Perfect” Trend Day, study today.
Corey Rosenbloom
Afraid to Trade.com
Follow Corey on Twitter: http://twitter.com/afraidtotrade
Register (free) for the Afraid to Trade.com Blog to stay updated
Corey,
Is there an indicator or something that you look at to determine a trend day or do you look at a gap in the opening and then determine the trend based on that gap’s direction ?
Thanks
Hi there.
I’ve been following your blog for a certain time now , and I really love really your blogs.
I have a question, hope you don’t mind.
I’ve seen that you always said that, during trend days, buy the pullback, and turn off all indicators. I personally find it difficult to determine whether it’s a trending day, and by the time we know that it’s a trending day, most of the time, it’s already half way thru.
Would you mind share with me how to determine and early trend day? Thanks in advance. 🙂
RK,
I generally default to price in terms of pre-morning action, expected structure, and the opening gap (and whether an attempt to fill occurred). For confirmation, I always have up the TICK, TRIN, and Breadth (and morning volume).
You’re trying to build a case – there’s no one indicator that says “Trend Day.” I guess if I had to say, then the biggest clue is the gap.
Lionel,
That’s the $64,000 question isn’t it?
You’re trying to assess structure as it develops, and the more trend days you observe, the better you’ll be.
If it truly is a trend day, then pretty much throw a dart and exit at the close and you’ll make money (reference today).
A trend day opens at the lows and closes at the highs (or vice versa).
So, if that holds true, then your finesse in entering or recognizing is irrelevant. Once you’re satisfied with the evidence that the day is unfolding in a trend day, get in and trail a stop and stay in until the close.
Generally you will recognize half-way through but that means half the day is left to profit.
Wish you would look at the Emini or something one could trade in. Can’t trade the Dow Jones, you know.
How about a look at ES or something else one might trade in? Like your Dow-analyses but i cannot seem trade the Dow.
your site does not agree with the googlebrowser, by the way; sorry for double posting
Roberto and RDV,
Good points. I look at the Dow (specifically DIA because you can trade it) as a proxy for the market in terms of structure and opportunity. I leave it up to you to translate opportunity into your chosen vehicle, be it DIA, SPY, @YM, @ES, or even a double leveraged (or inverse) ETF. There’s simply too much to discuss.
I’m trying to show trading ideas or concepts – or low-risk opportunities – and then leaving it up for the reader to apply into a methodology or actual practice.
My thought process is that the S&P 500 would be a better vehicle to show analysis than the Dow going forward.
Oh, and though I trade using @YM (and soon @ES) through TradeStation, I much prefer the chart images of StockCharts which does not show futures contracts. I would show that if they did.
Besides, I don’t want to give away all of my secrets!
More people understand and relate to StockCharts charts than TradeStation, and SC just has a cleaner feel.
I am calling yesterday my perfect missed Pandit Rally Day, well done as usual Corey.
As we speak, it seems we have had a Fractual wave 4 confirmation, it could well go higher but would expect poor economic and fundamentals to lead us down and confirm capitulation Fractual 5th at some point-unless i am wrong, which is more than possible.
Very useful lesson you have shared – do not short $1 gap on the DOW. What are your thoughts on another strategy: “Buy the five minute high and sell at 10:00”. This could have been useful yesterday.
Jeremy,
I’m along with your line of thinking – fractal 4 up then into resistance (possible Fibonacci or moving averages) which gives us the final “really scary” Wave 5 down – capitulation forms, a (short-term?) bottom is formed and we do a big move up after that.
Jean,
Thanks. I’m not familiar with that strategy. It’d be easy to test out for edge. I’ll have to do more work with that one.
Corey,
It’s a plausible scenario, since we have not had downside capitulation yet.
I sense one should perhaps not jump in short just yet, Tuesdays volume suggests there might be some more upside to come after some consolidation, the bulls have woken up and their hopes may not ebb away so soon.
I would be very interested in your results. Thank you.