Triple Fibonacci Confluence at 800 on SP500
I’ve been pointing out Fibonacci confluence at the 800 level on the S&P 500 for a little while now, but I wanted to show a third layer to the 800 level which perhaps is turning out to be rather significant resistance. There’s no guarantee 800 will hold, but it can be helpful to know of what’s overhead resistance that could give the bulls trouble at this level.
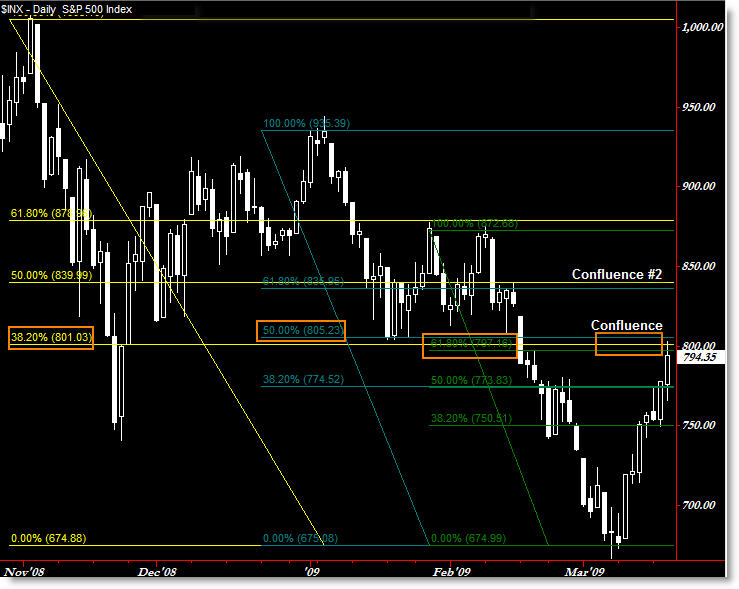
I captured this chart from TradeStation and tried to draw your attention only to the Fibonacci Confluence Levels.
All Fibonacci grids are drawn to the recent March (closing) Low at 675.
Grid 1 is drawn from the November highs
Grid 2 is drawn from the January highs
Grid 3 is drawn from the February highs
Letting the chart speak for itself (click for larger image), the November 38.2% Retracement is at 801; January 50.0% Retracement is at 805; and February 61.8% Retracement is at 797.
Again, there’s no guarantee these levels will stop the market going up here, but it’s something quite interesting that we get three levels of almost identical confluence at the 800 level, which also serves as ’round number’ resistance and prior support off the January lows.
I’m sure everyone’s watching this level like a hawk; you should probably be watching it as well if you’re not already.
Corey Rosenbloom
Afraid to Trade.com
Follow Corey on Twitter: http://twitter.com/afraidtotrade
Register (free) for the Afraid to Trade.com Blog to stay updated